Bauke/tildes-issue-log
Bauke
/
tildes-issue-log
Archived
1
Fork 0
This repository has been archived on 2022-10-04. You can view files and clone it, but cannot push or open issues or pull requests.
tildes-issue-log/graphs/README.md

2.2 KiB

Issue Log Graphs

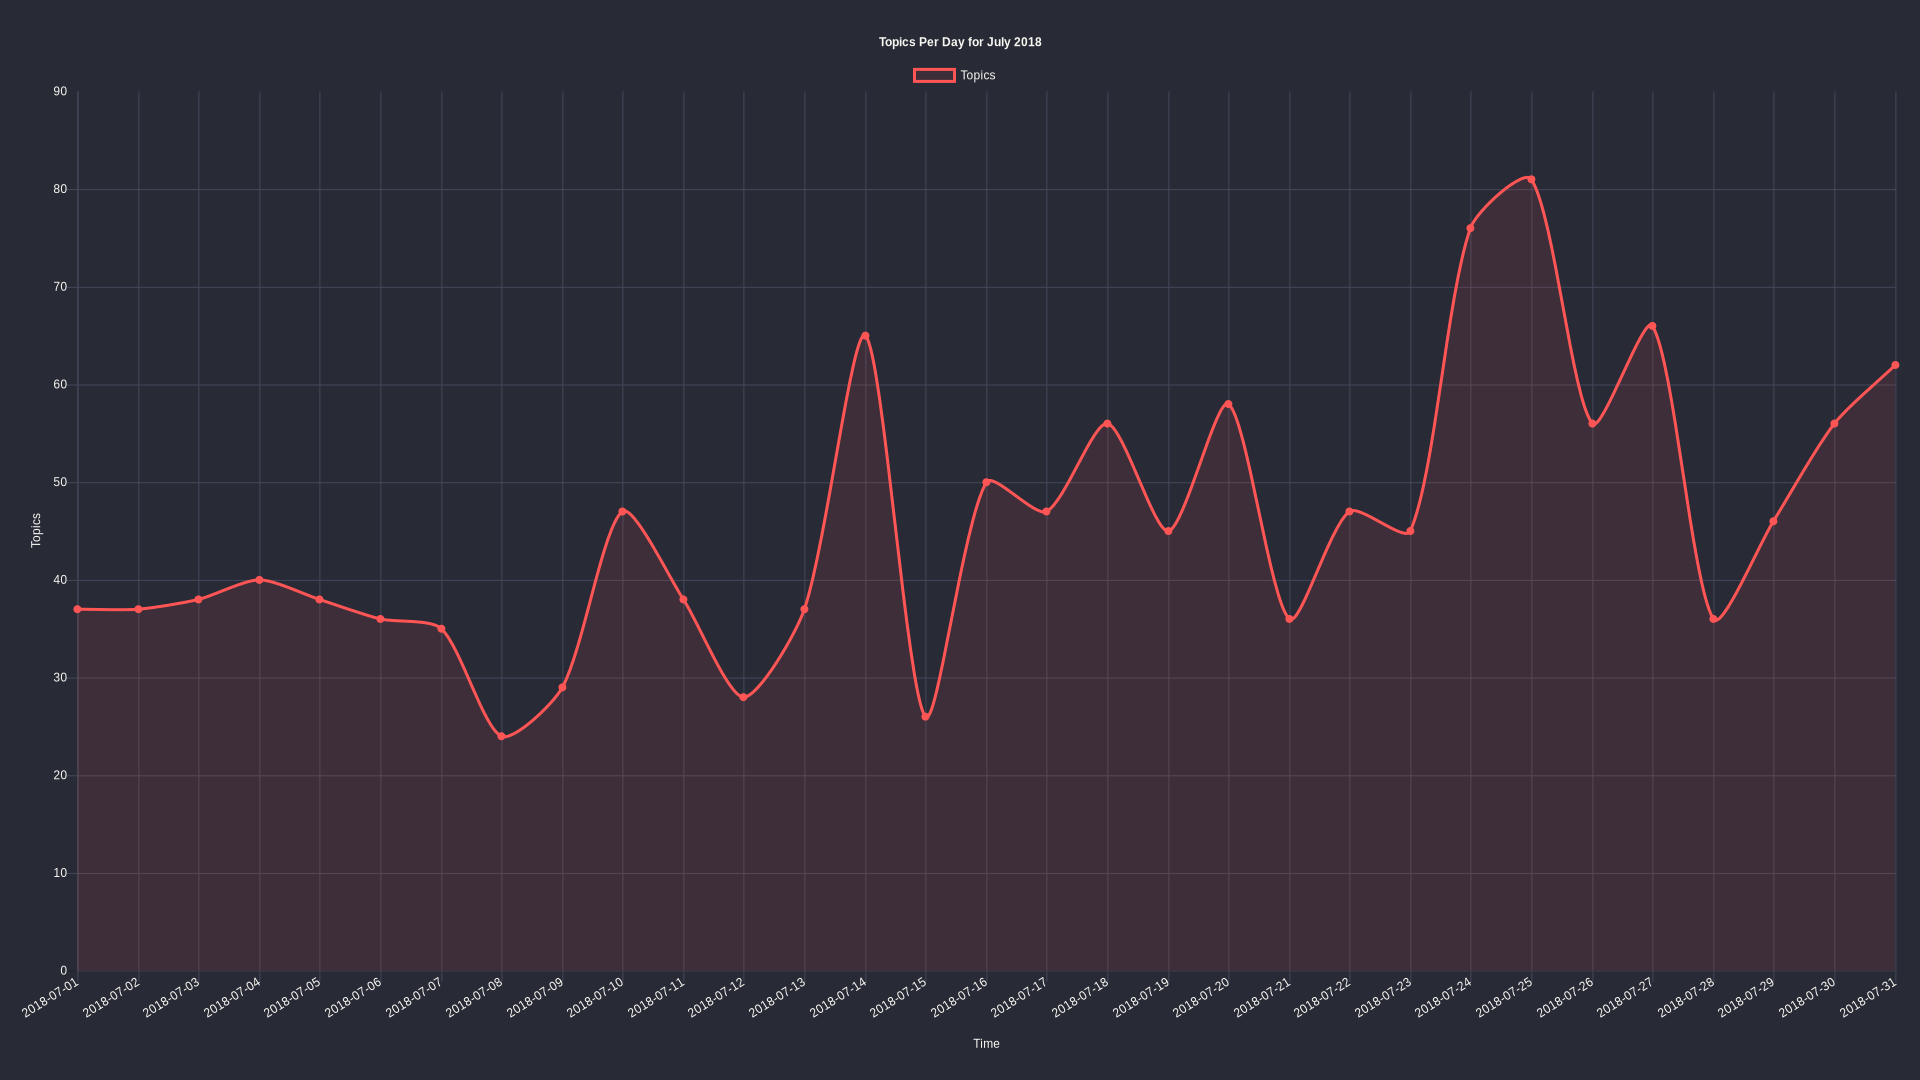
As a preliminary test, here are the topic activity graphs of every month so far (and the total one). Currently there are 2 different stats graphed, topics per day: how many topics were posted for every day in the month and topics each day: how many topics were posted on each day of the week in that month.
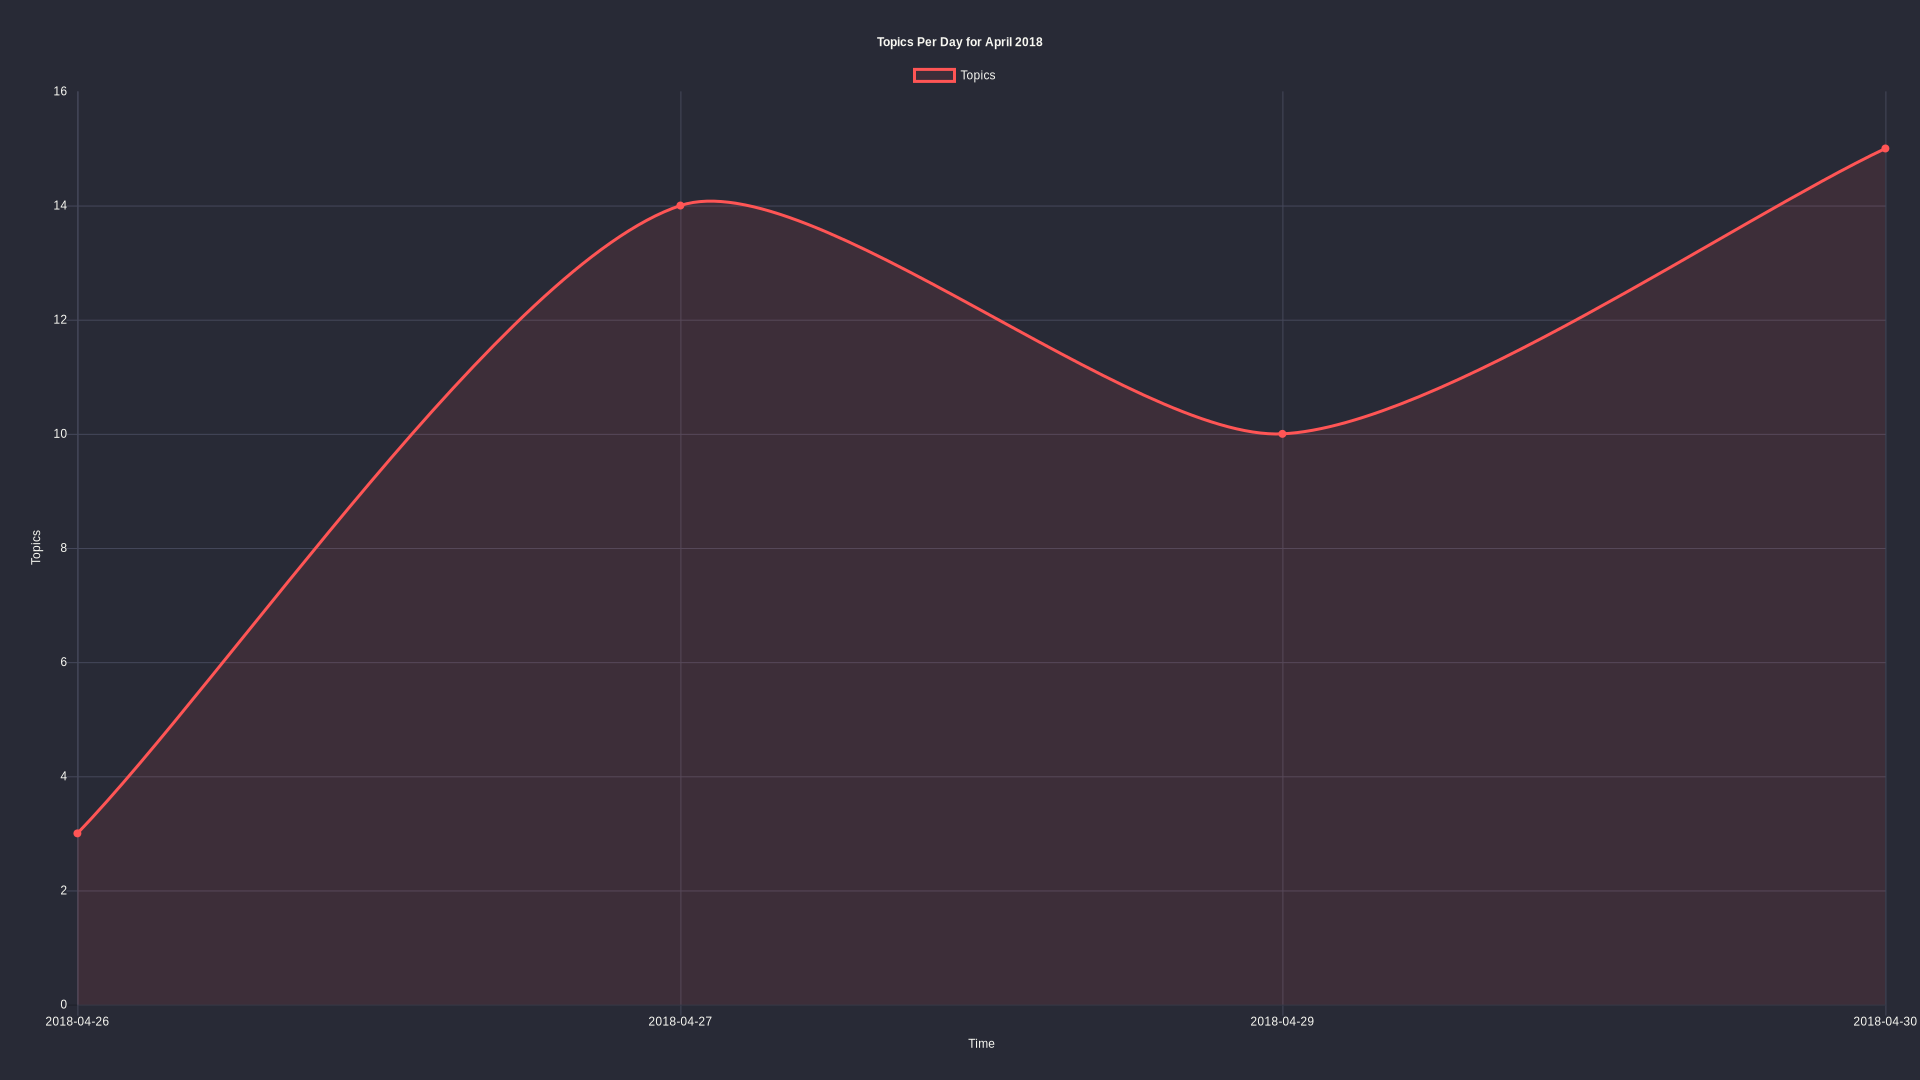
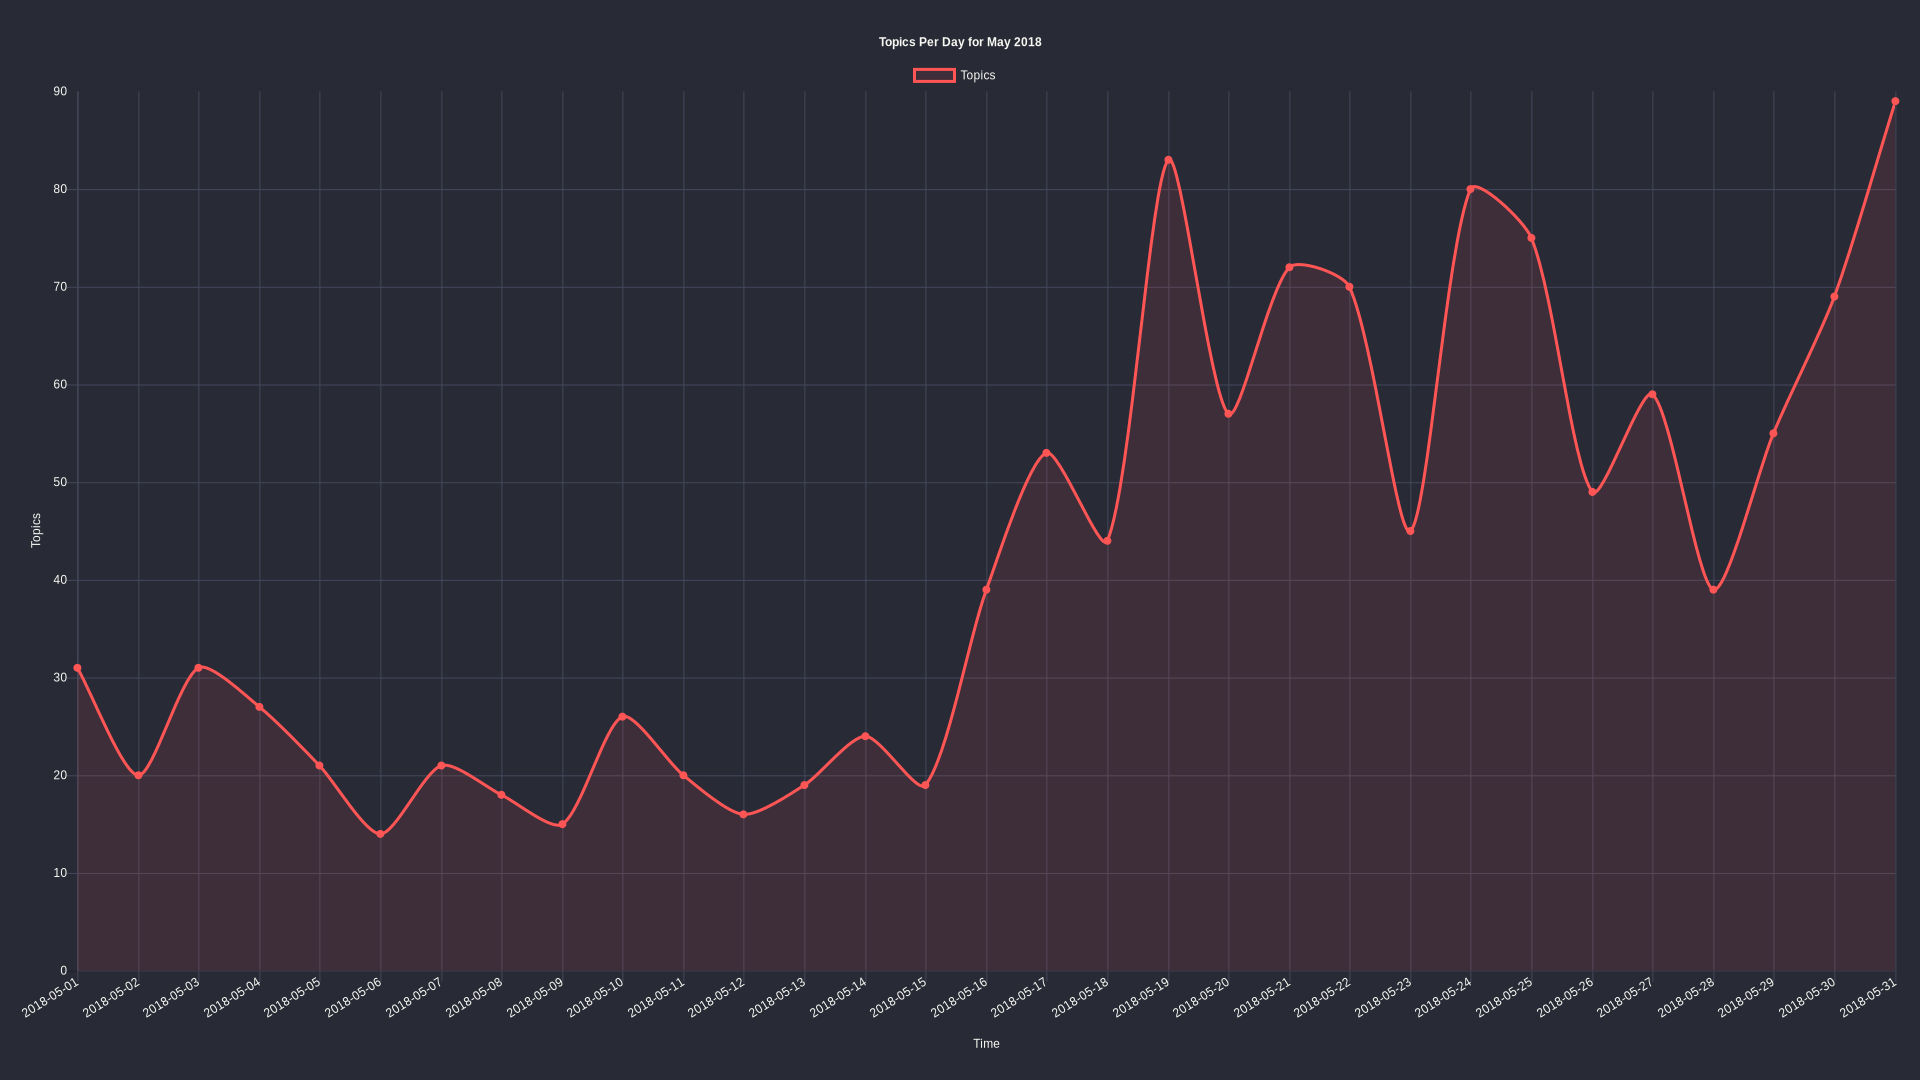
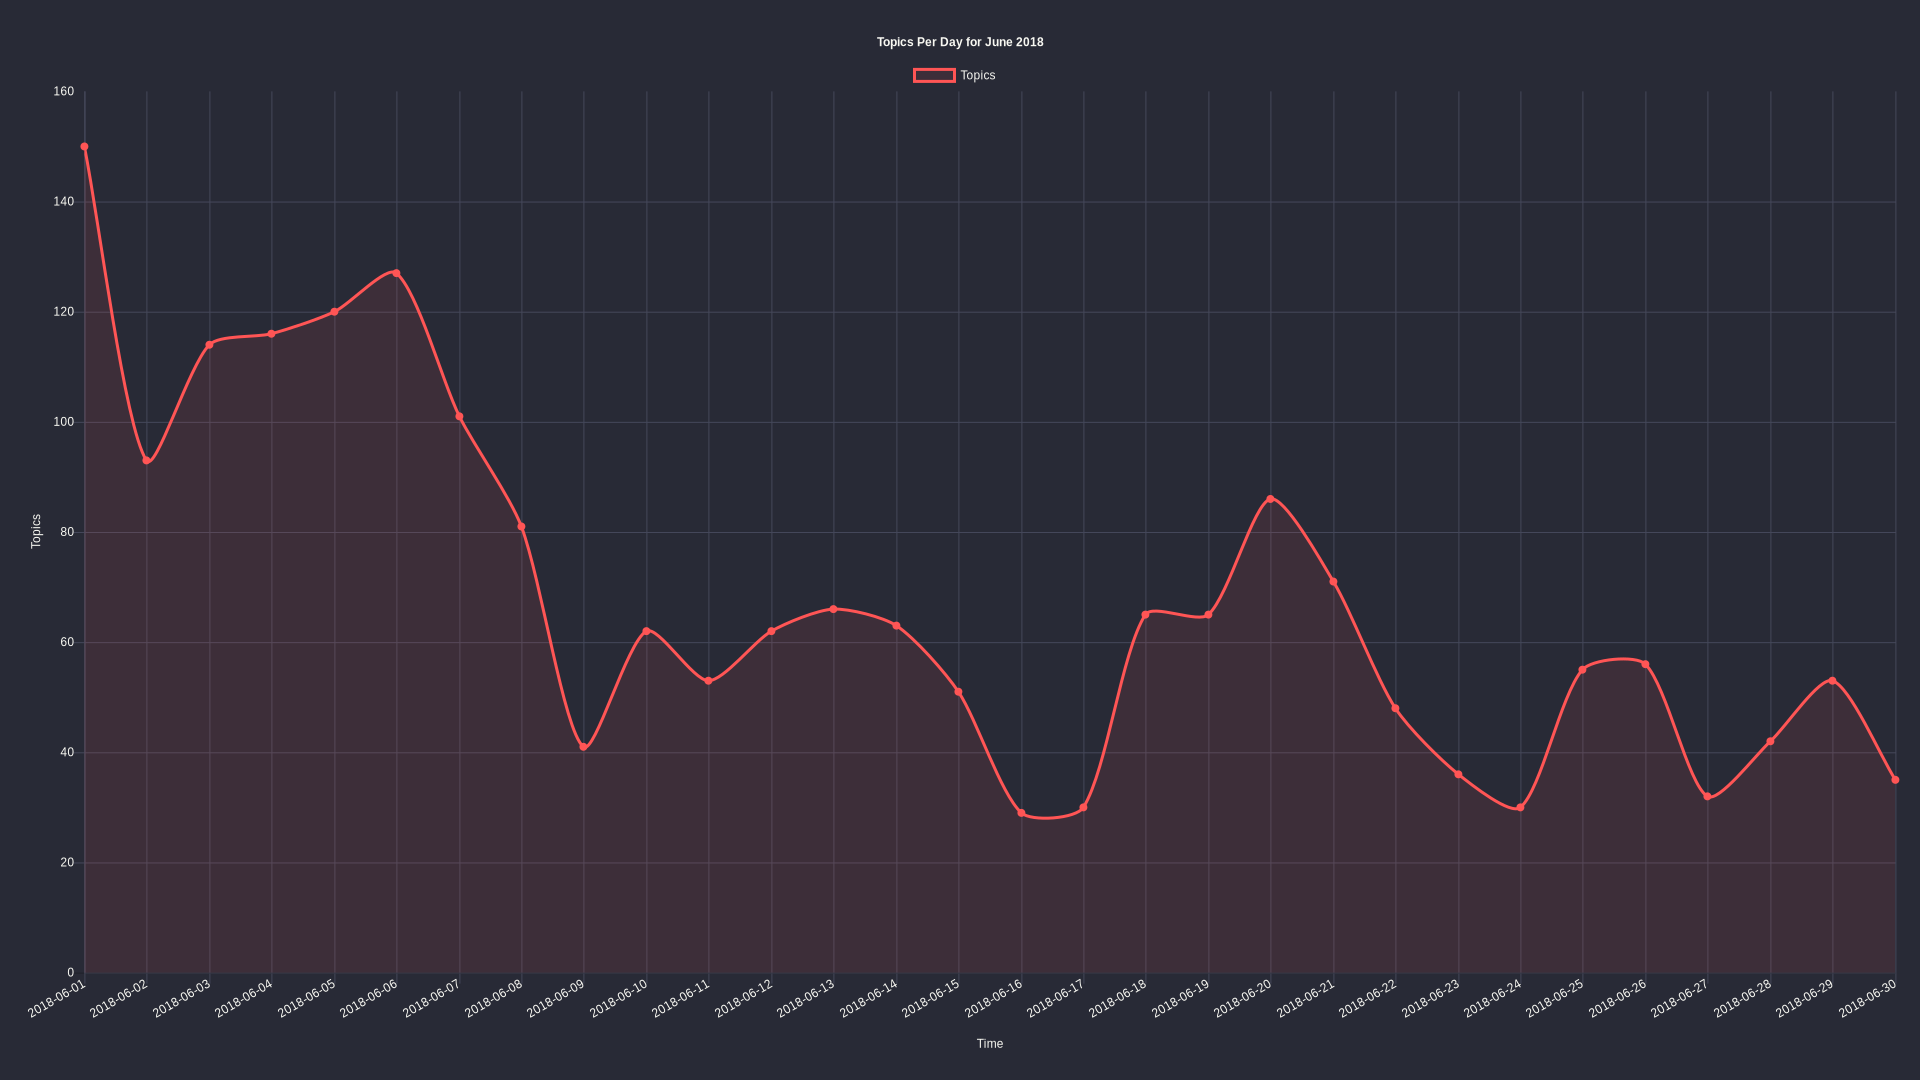
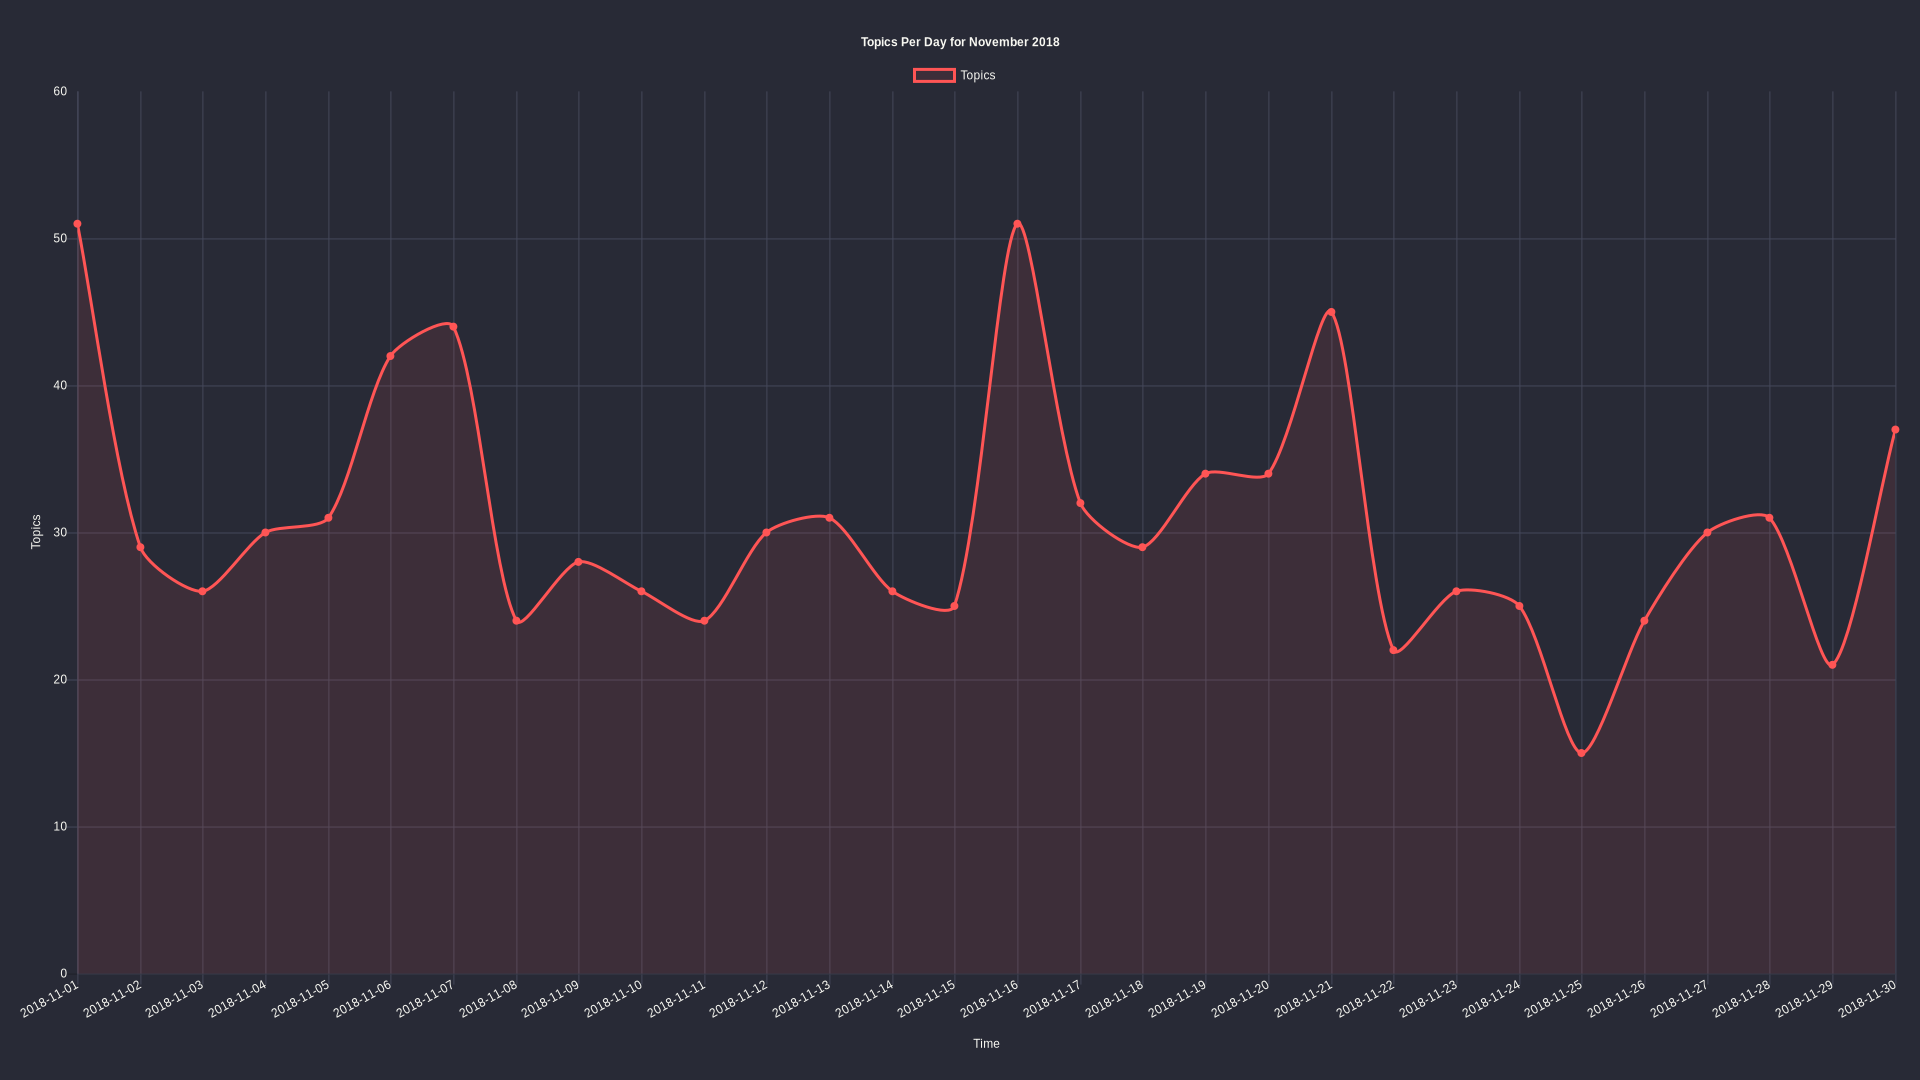
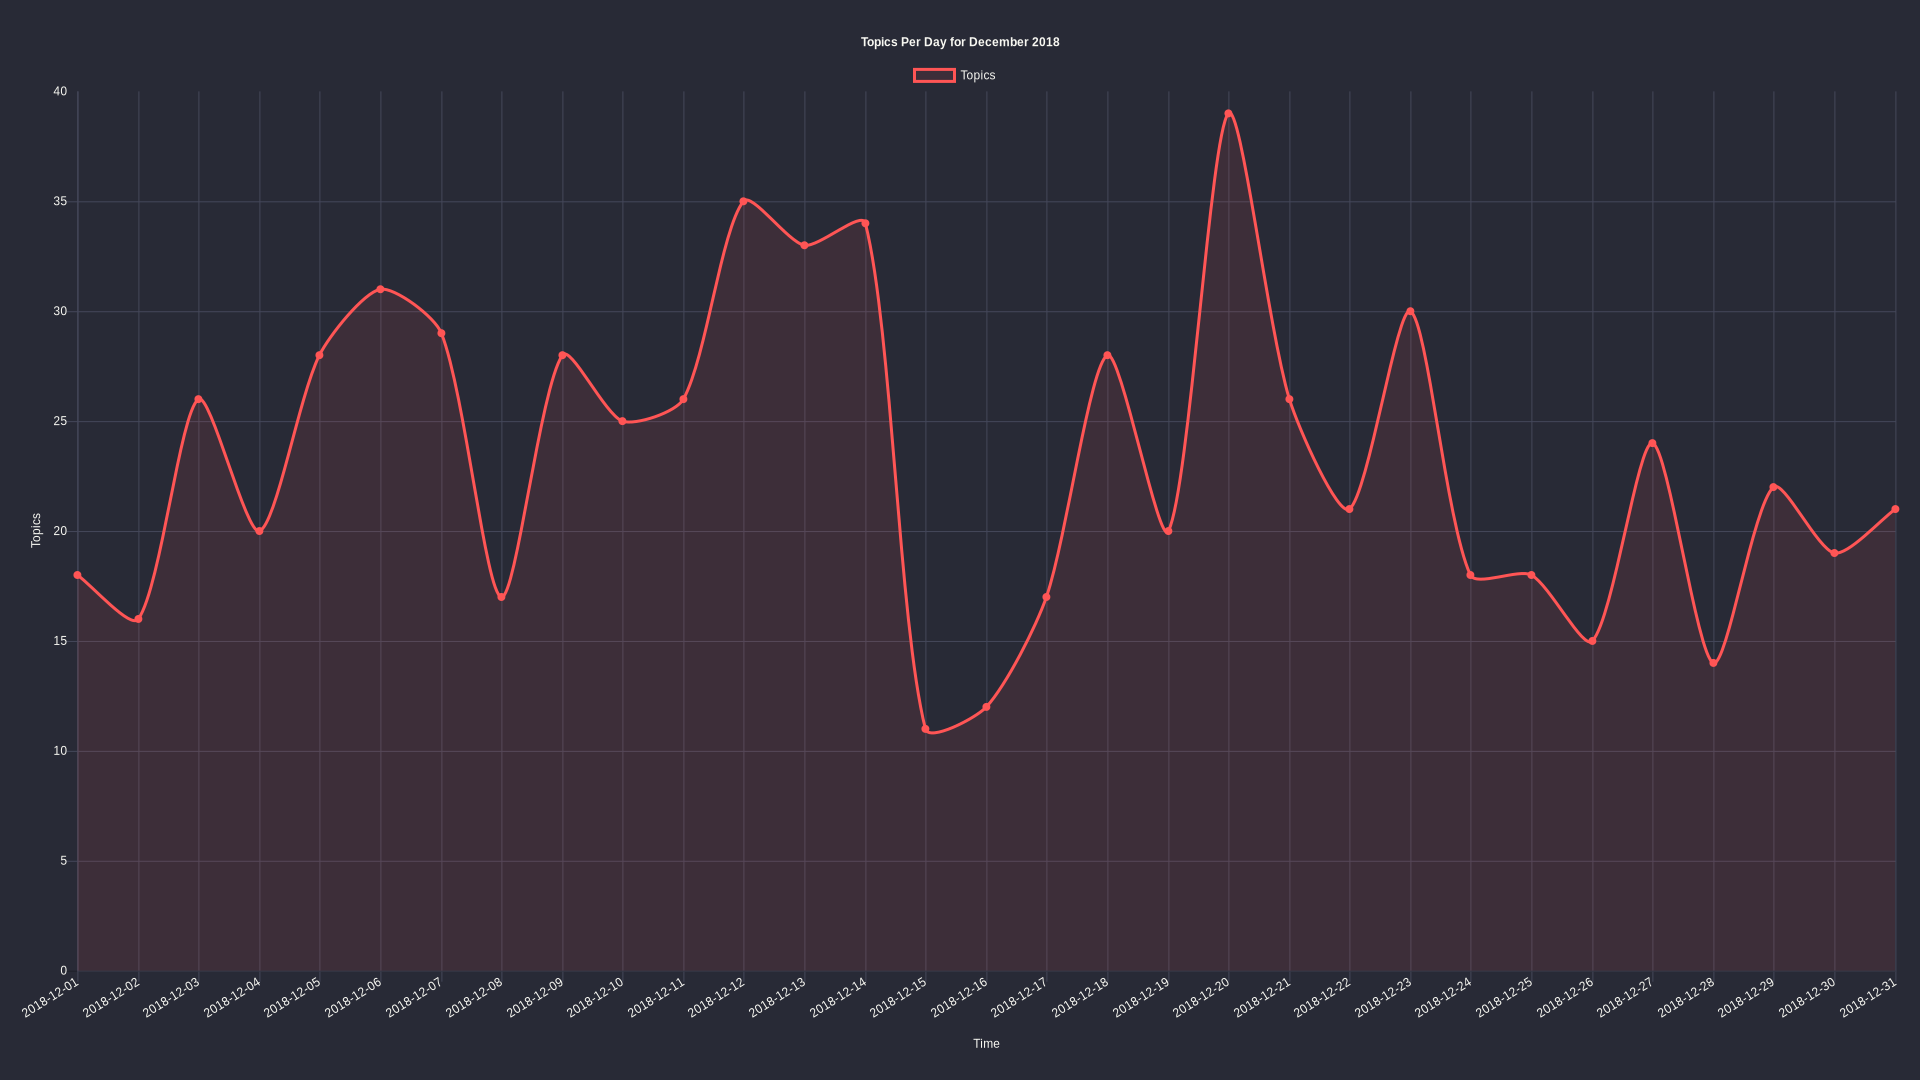
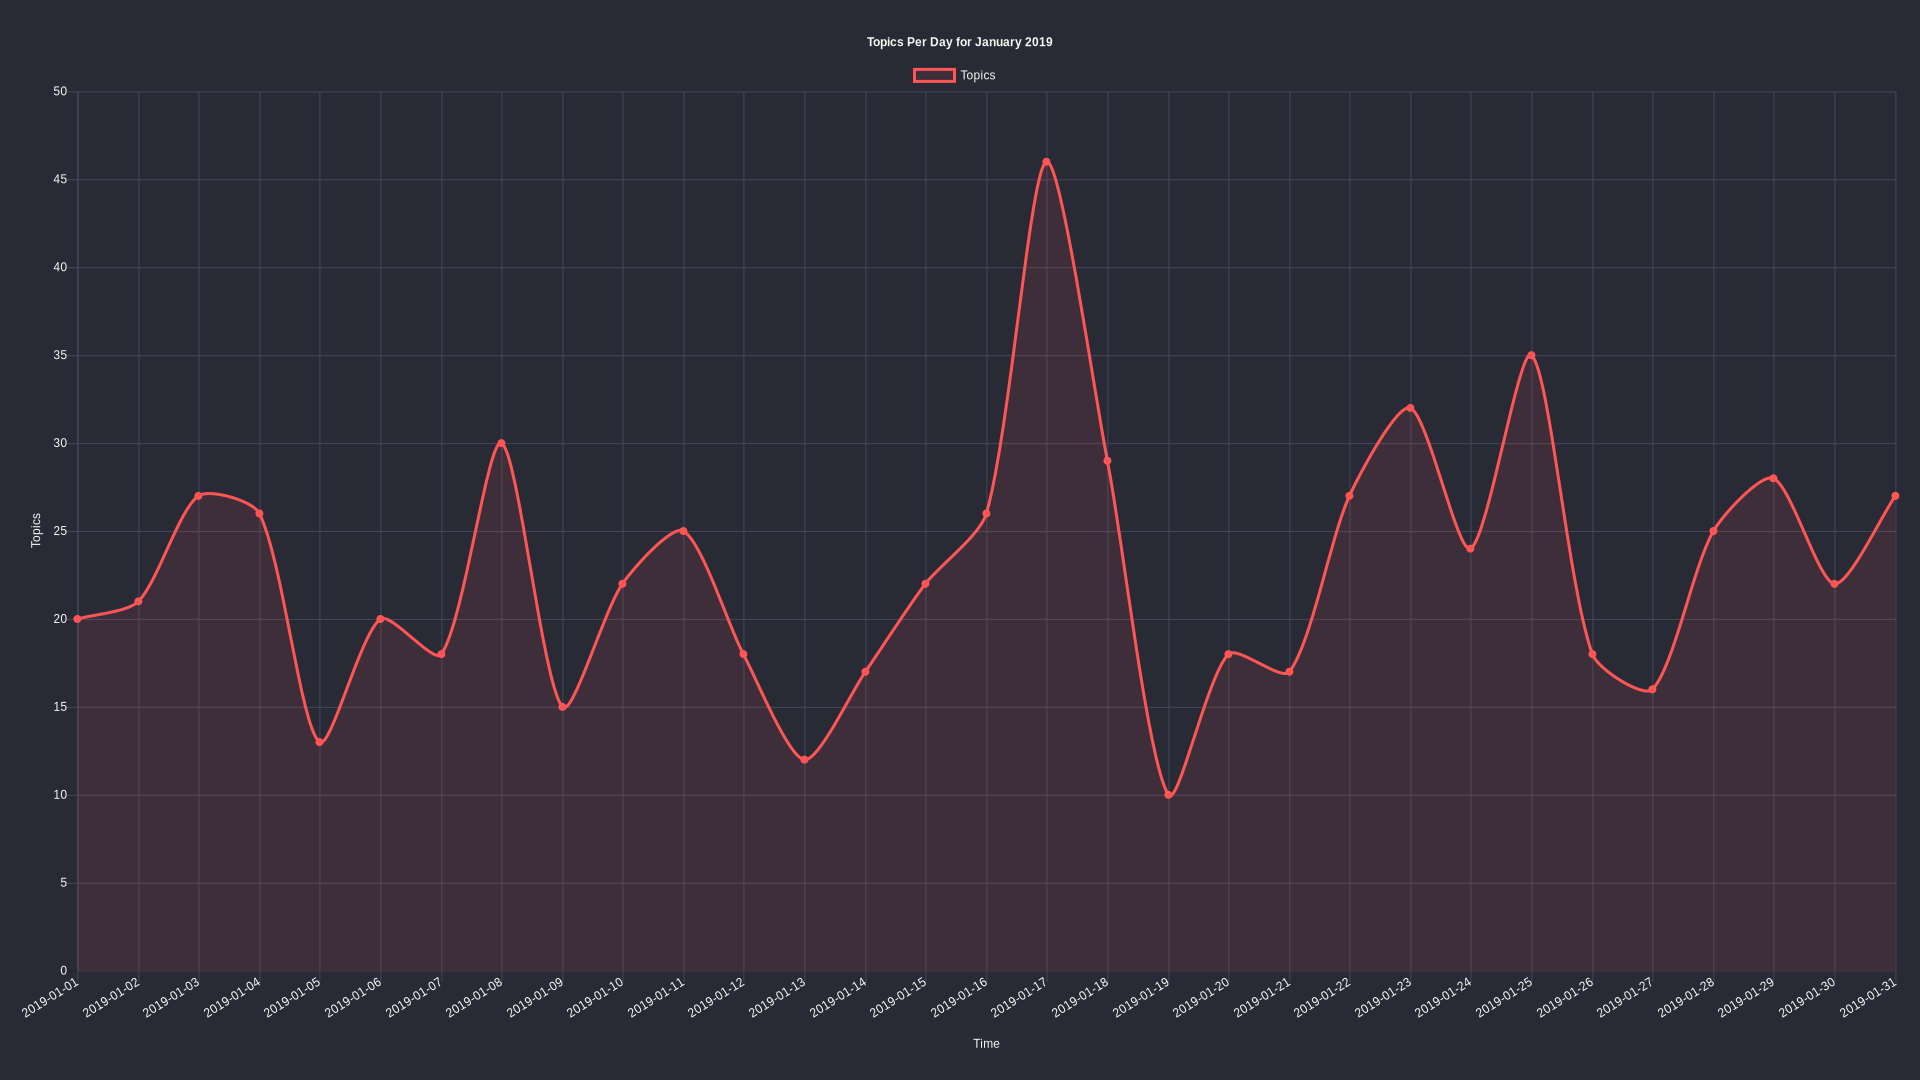
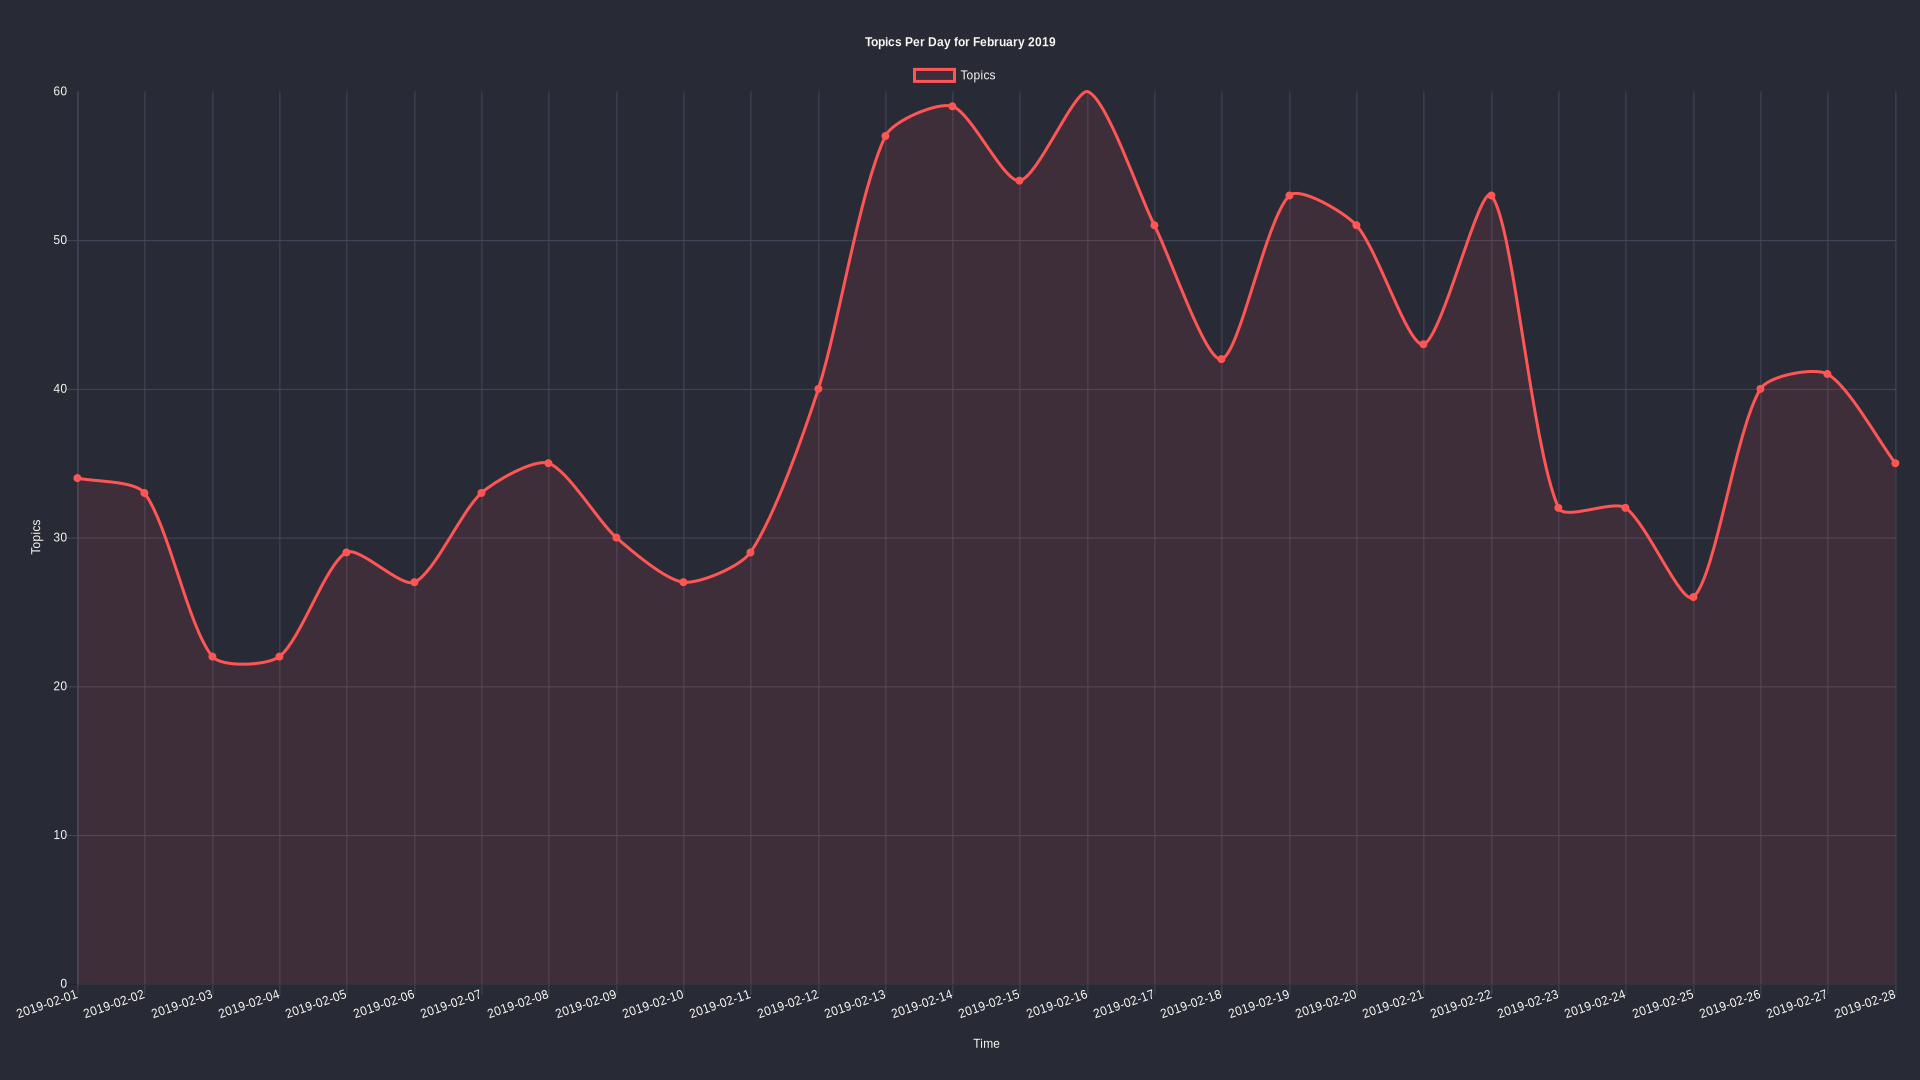
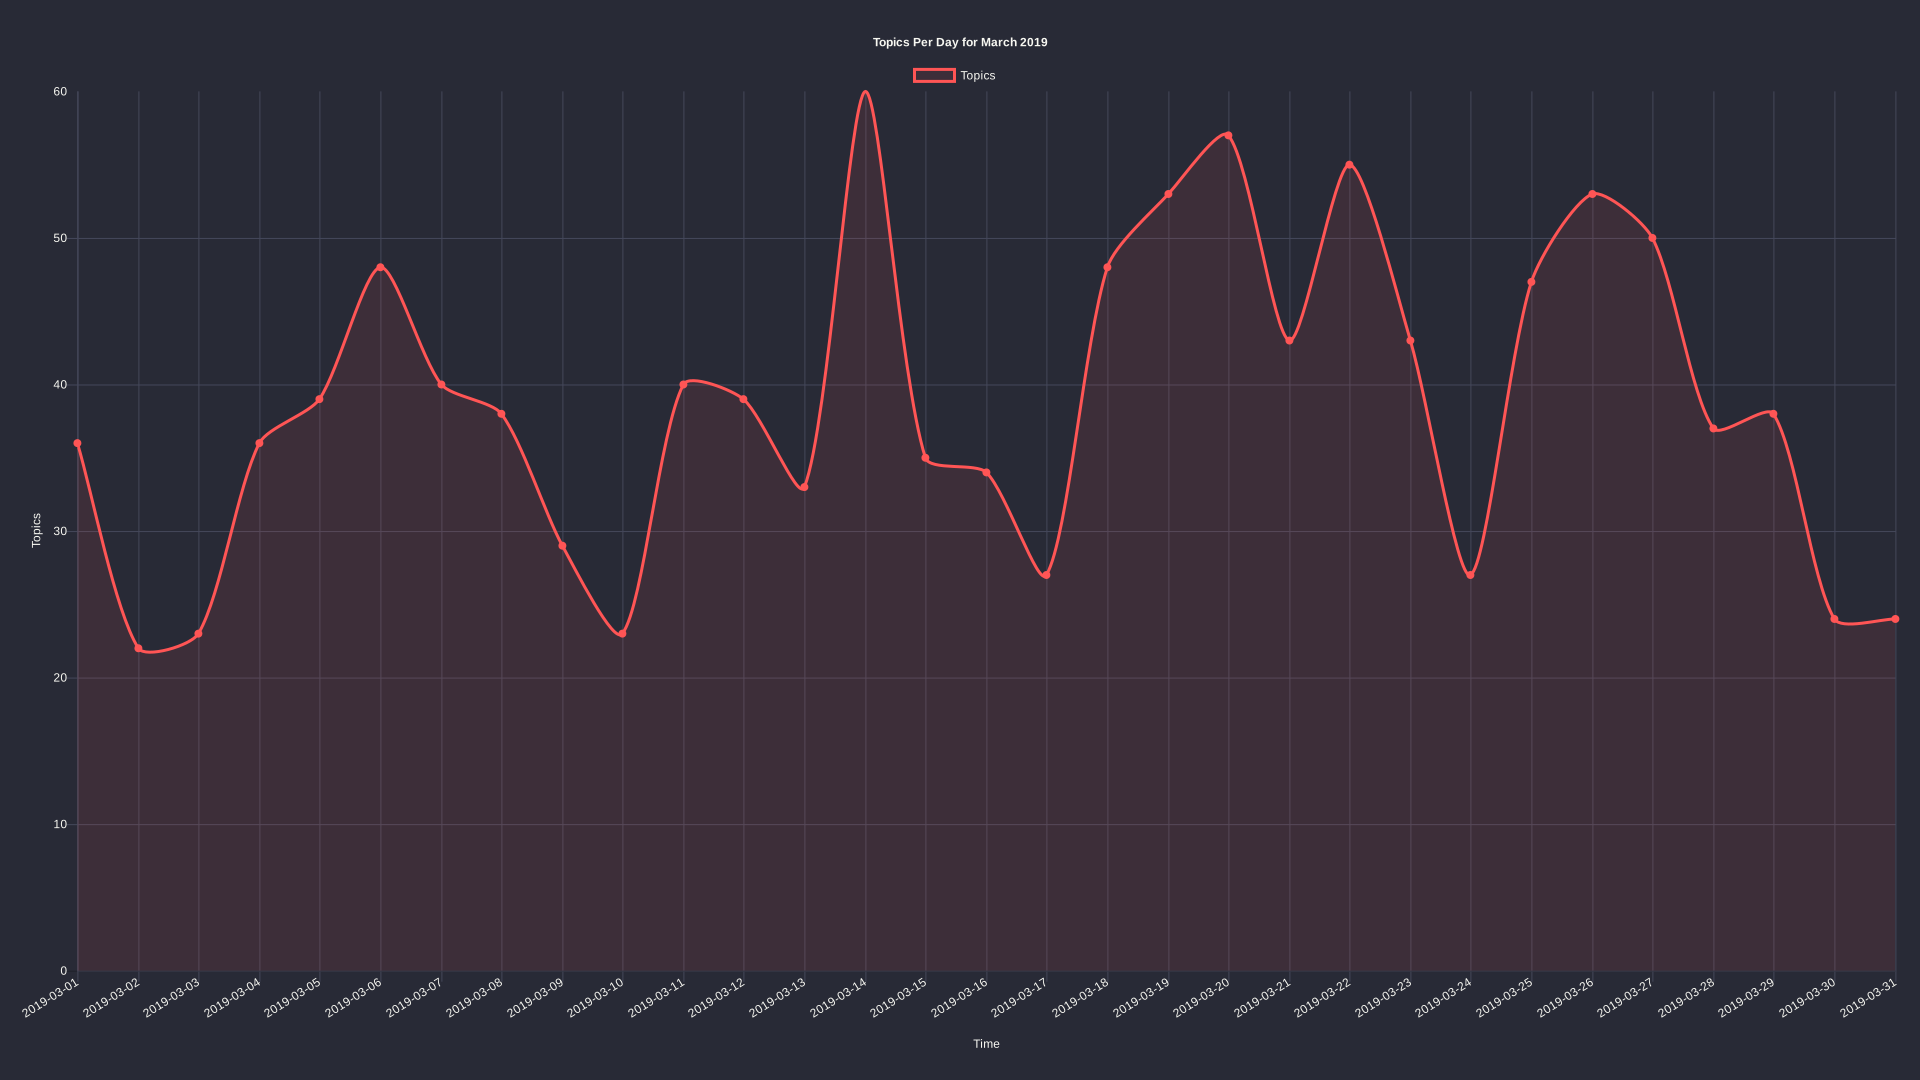
Topics Per Day

This first graph is the total amount of topics of Tildes, divided into weeks instead of days. All the other graphs will be per day.

Total topics per week

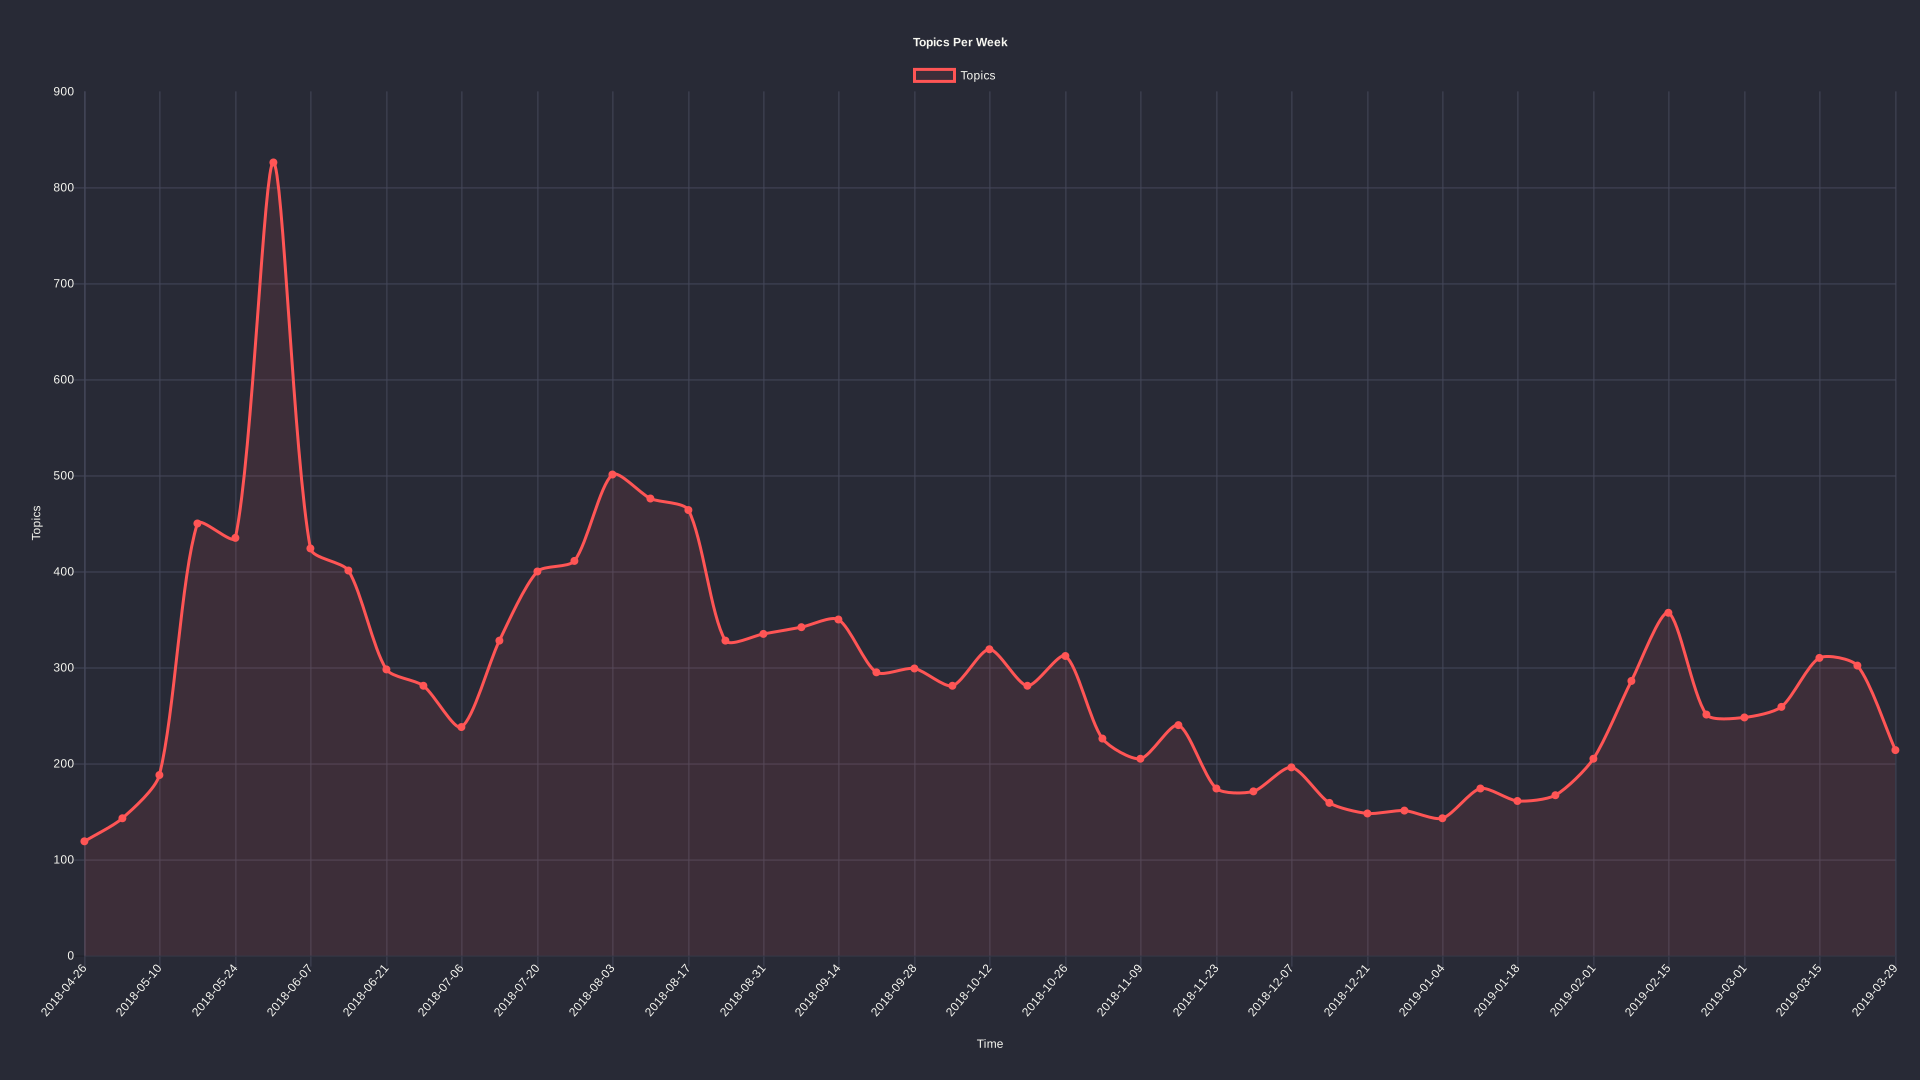
Tildes launched on the 26th of April, so there's only a couple days in this graph. :P
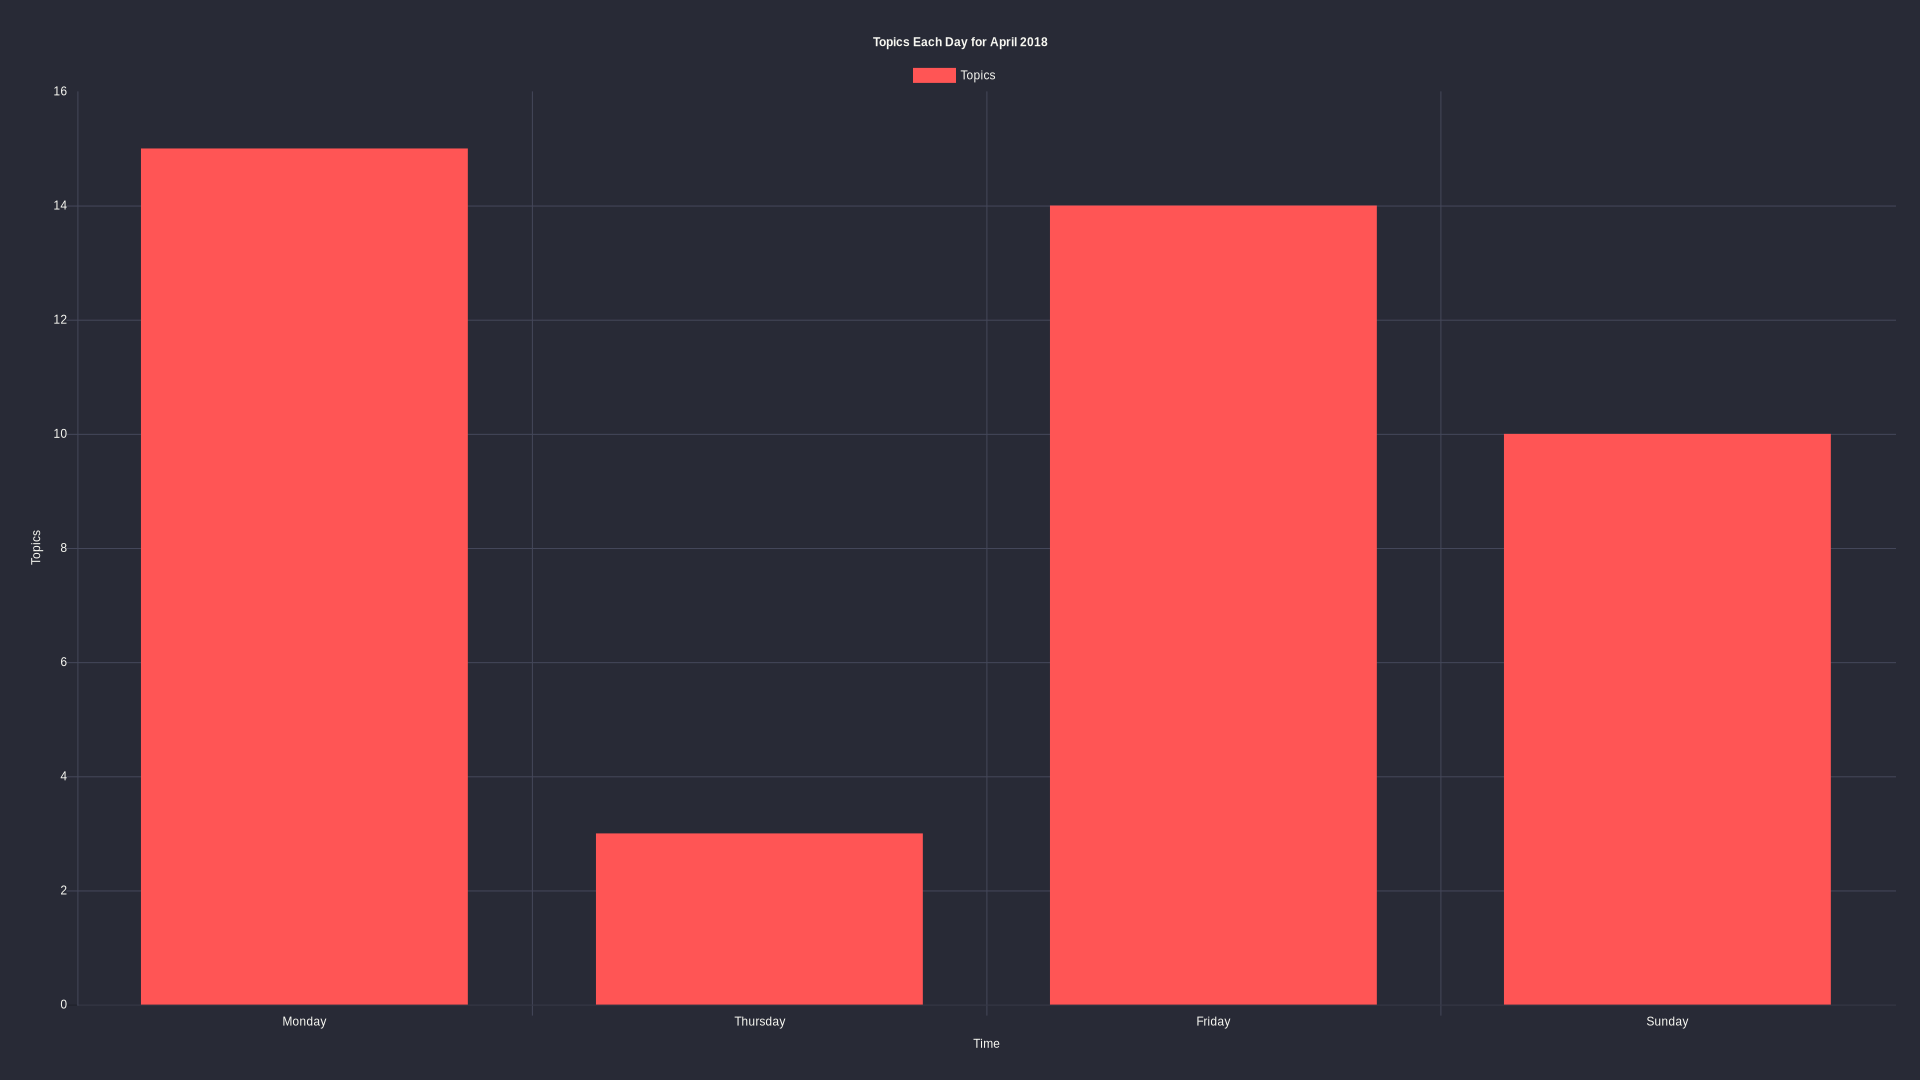
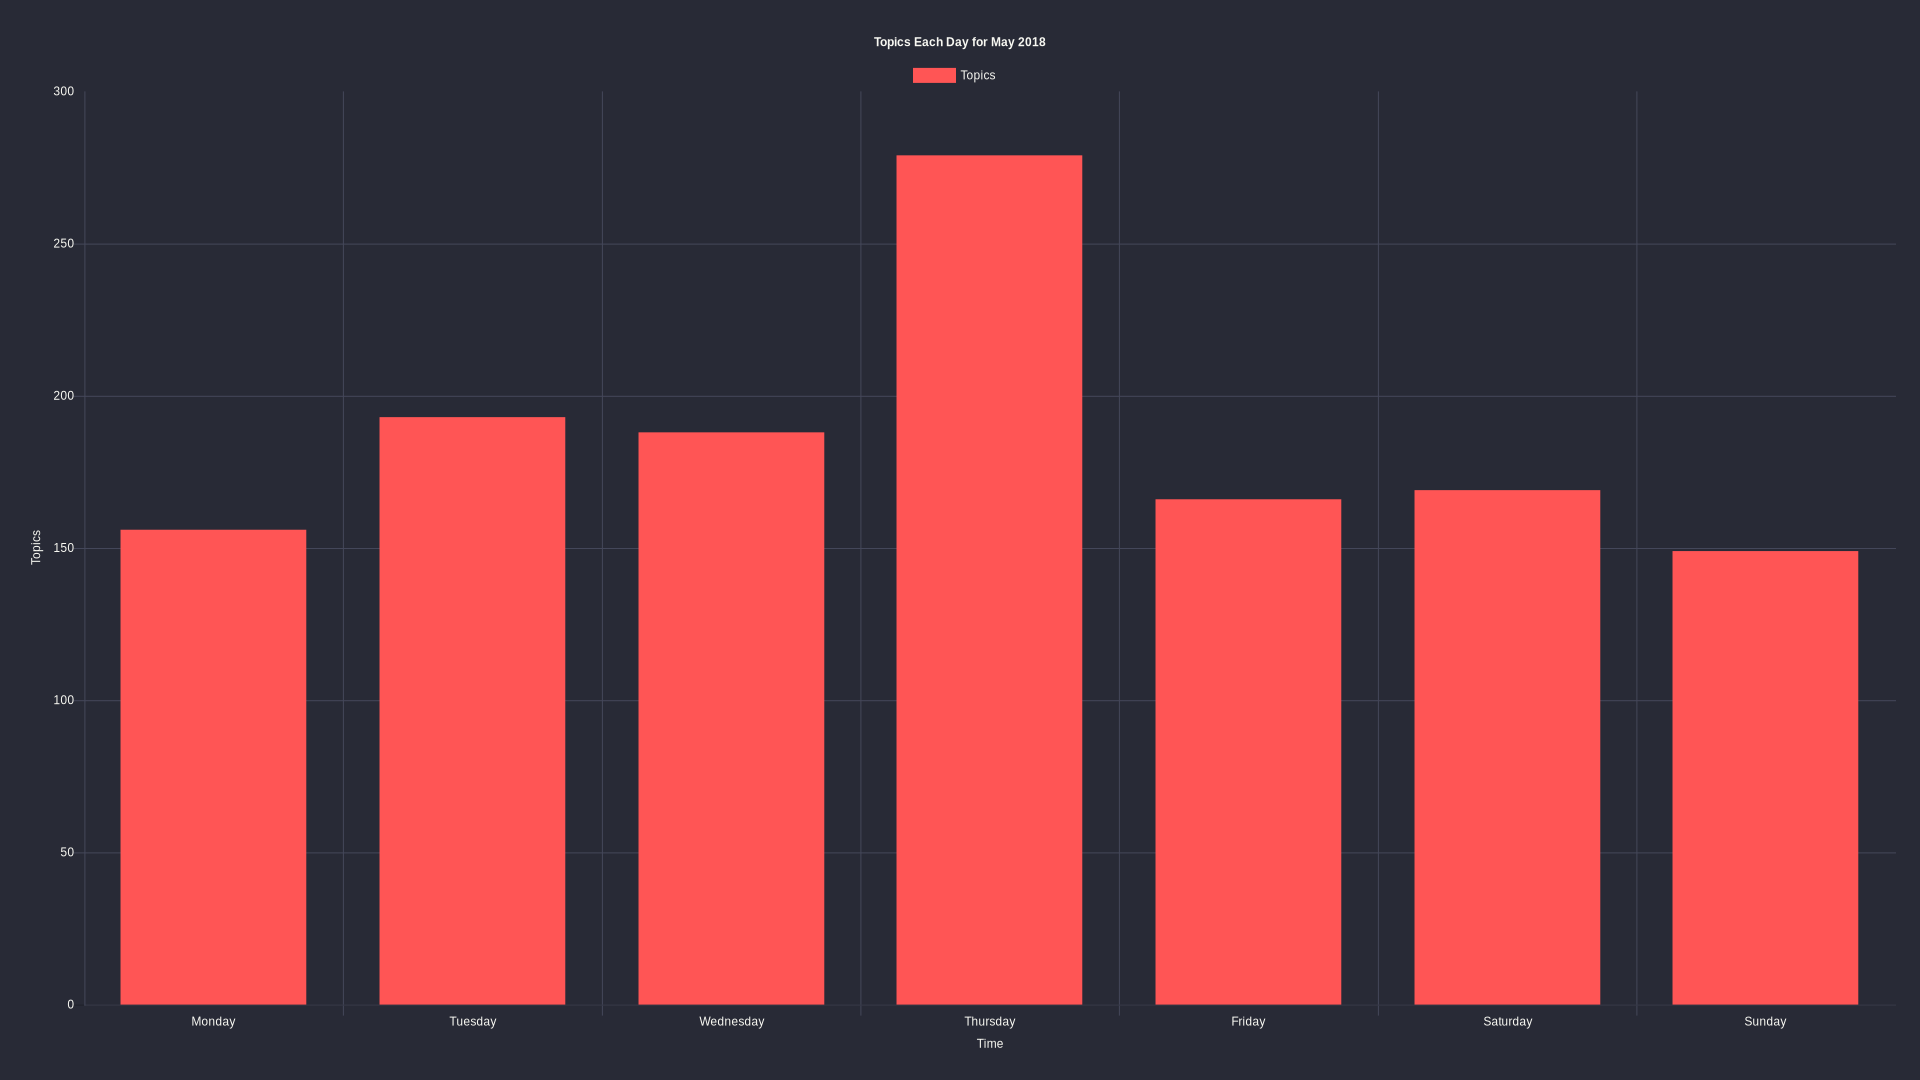
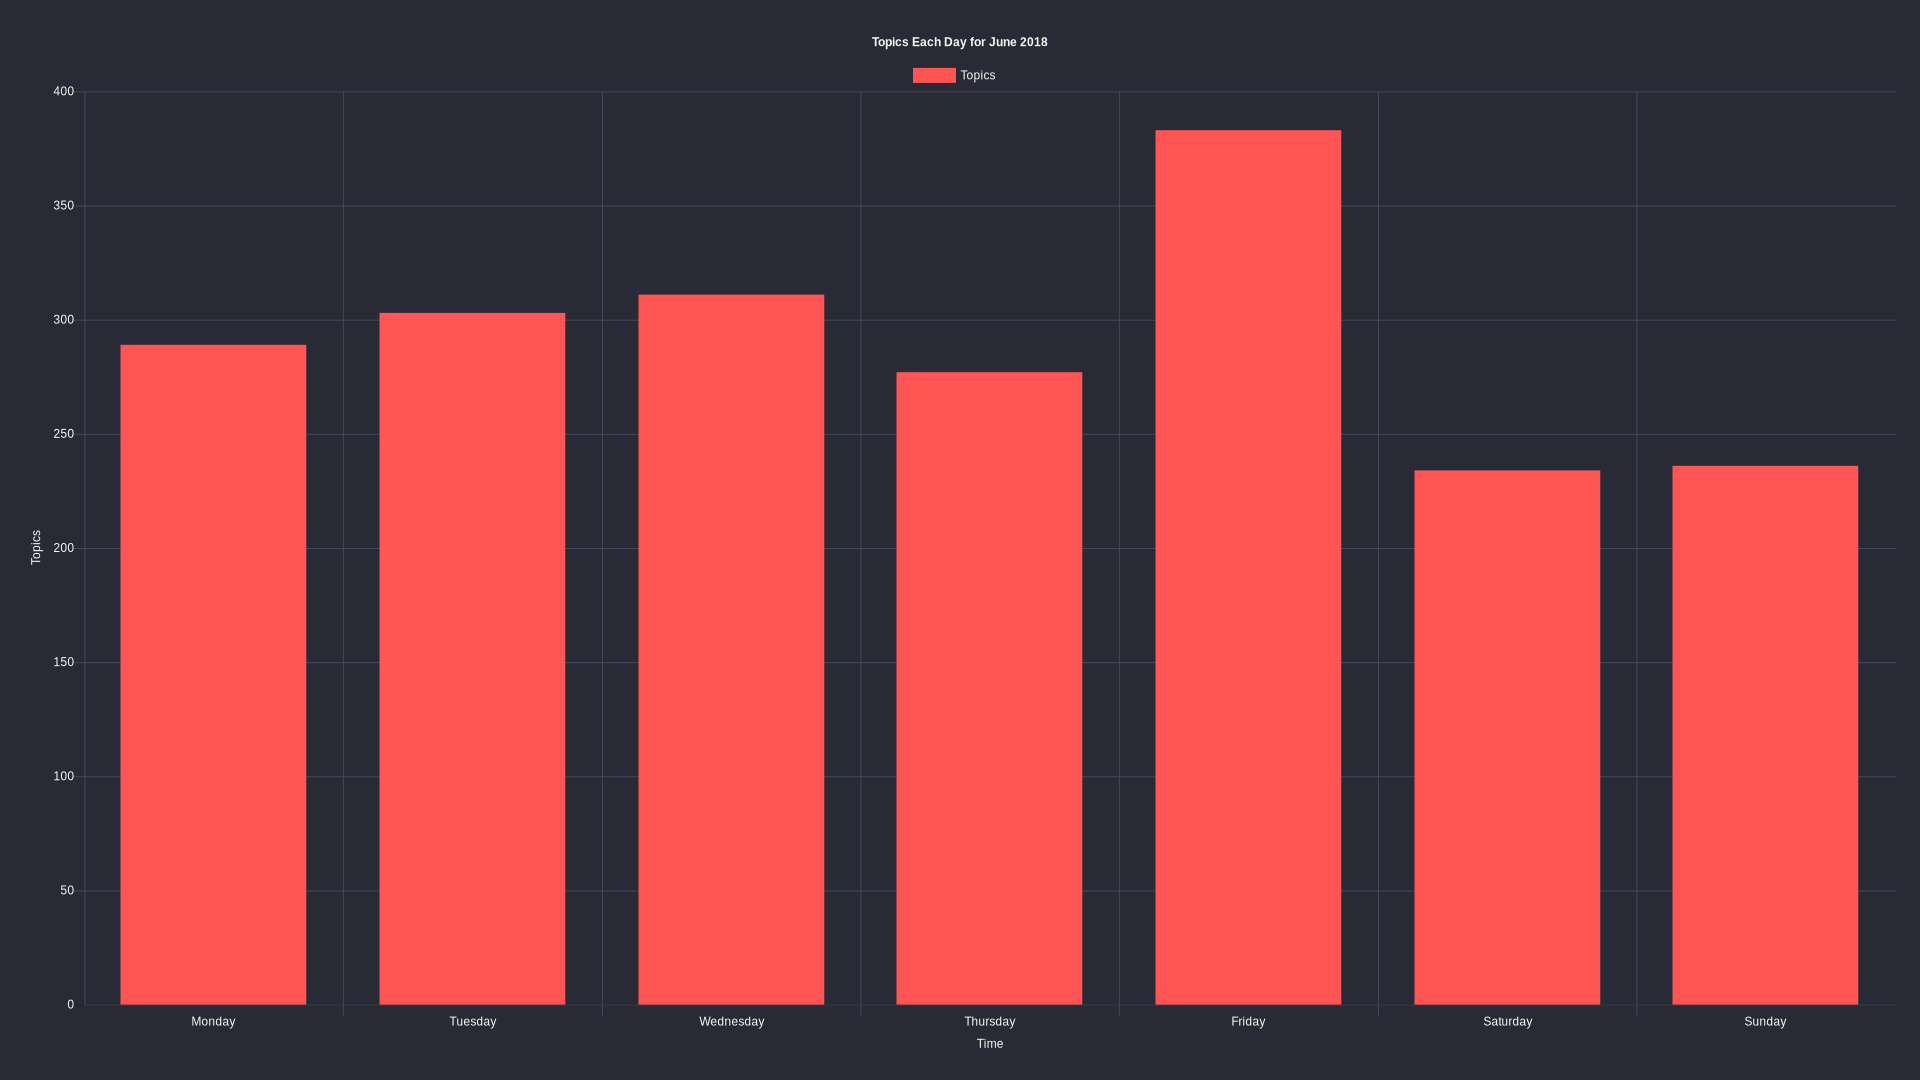
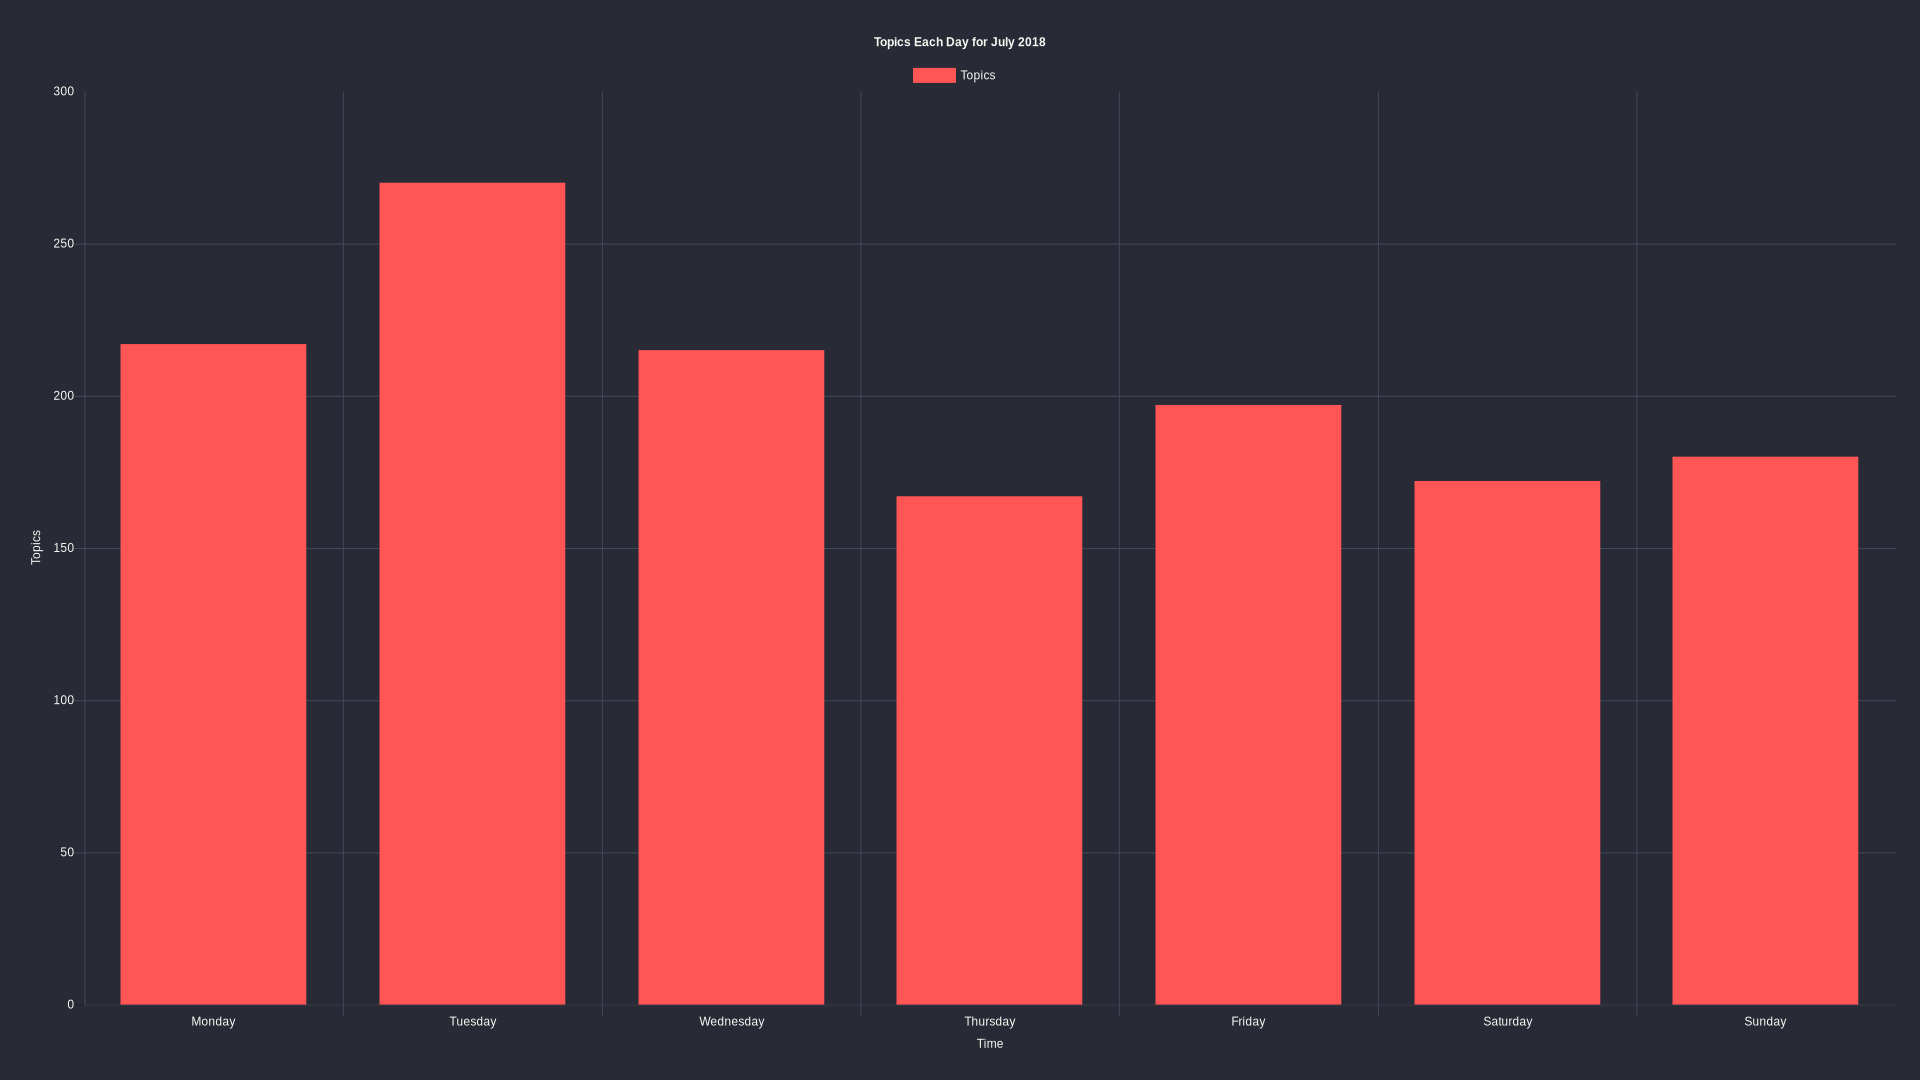
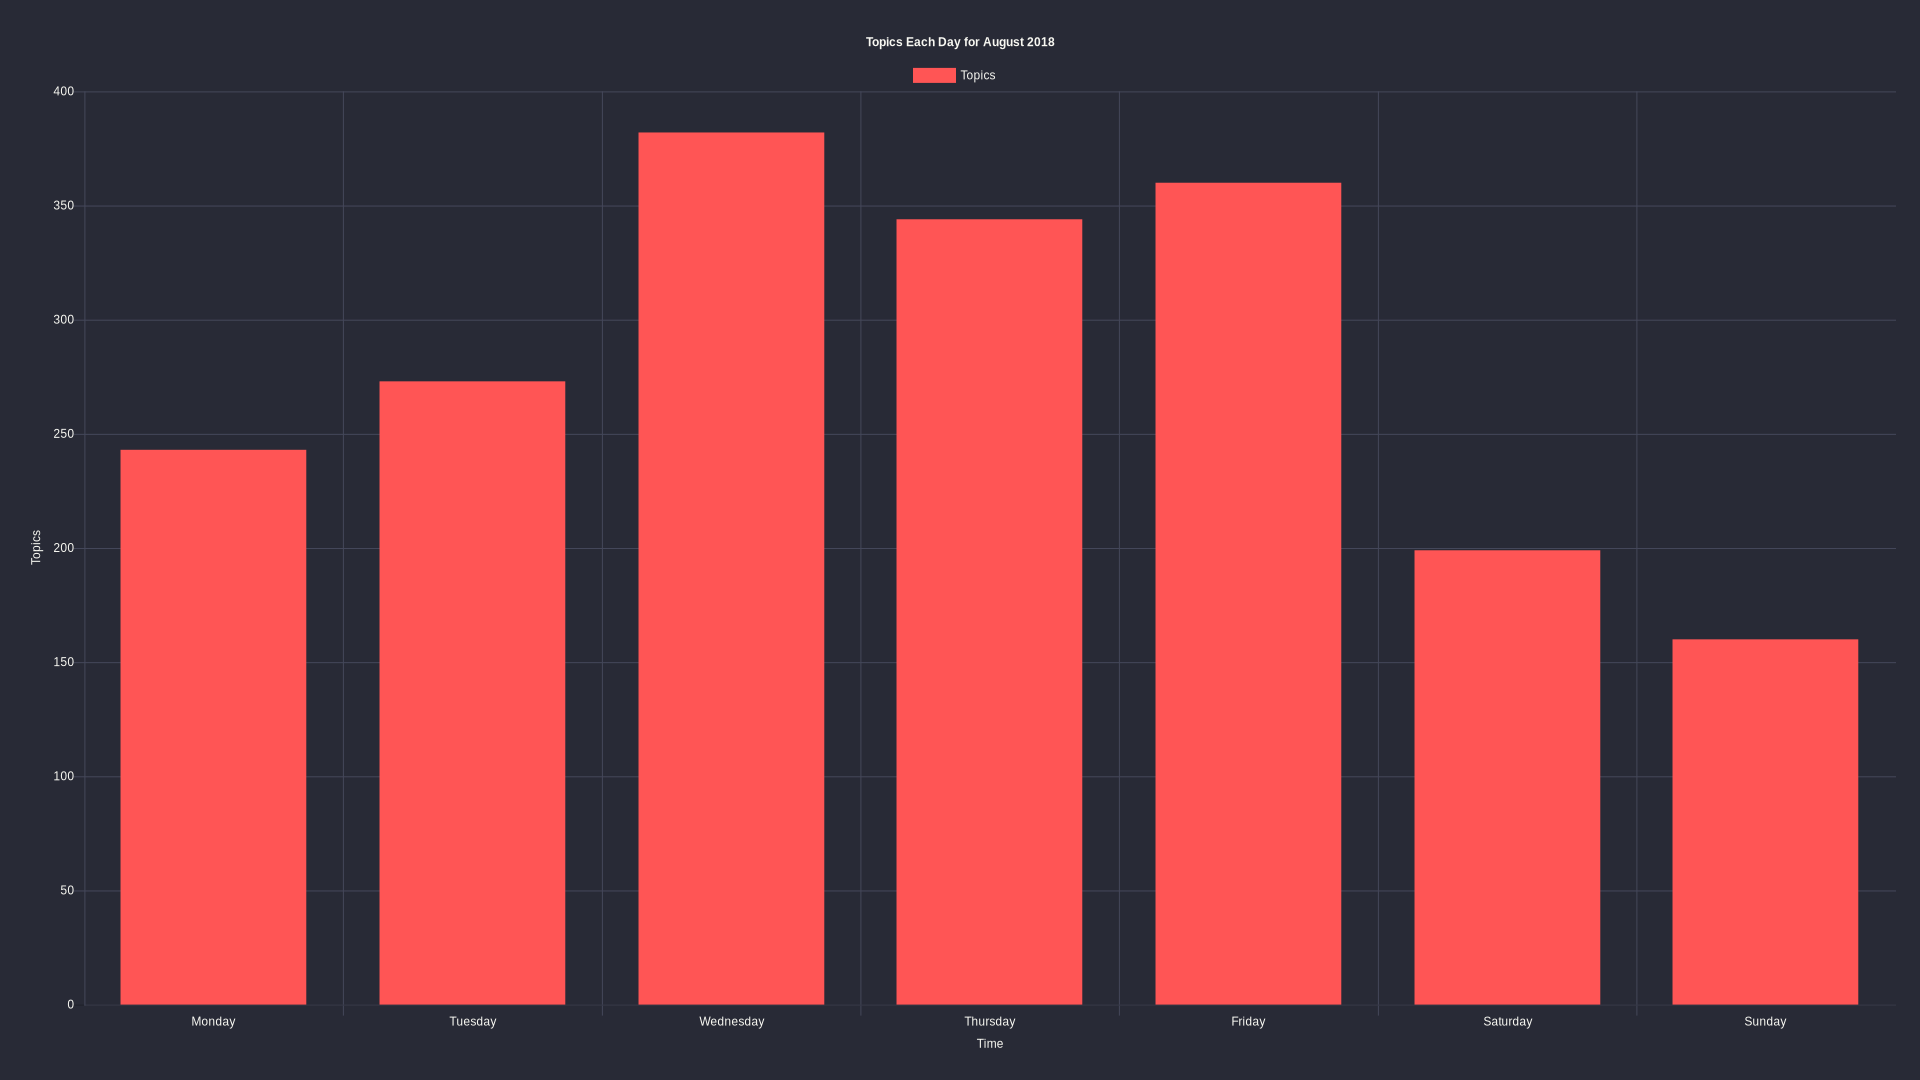
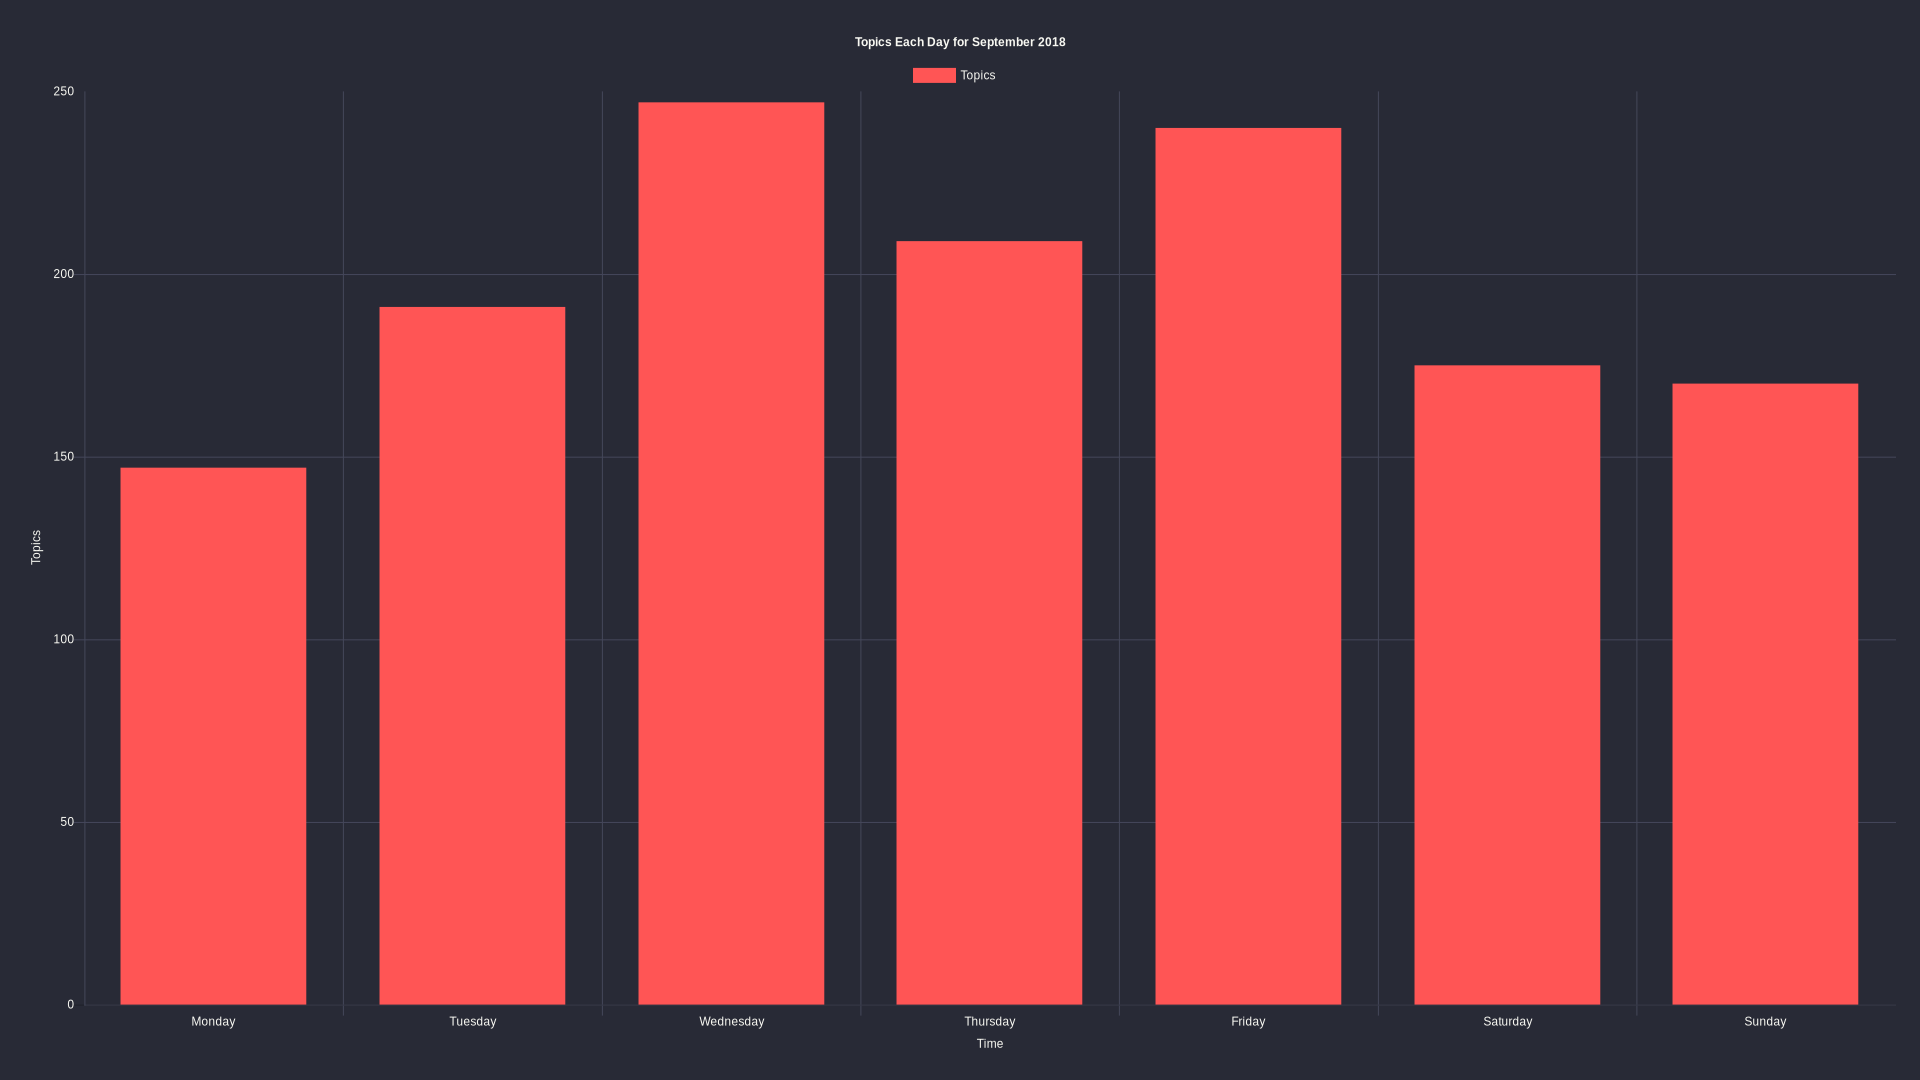
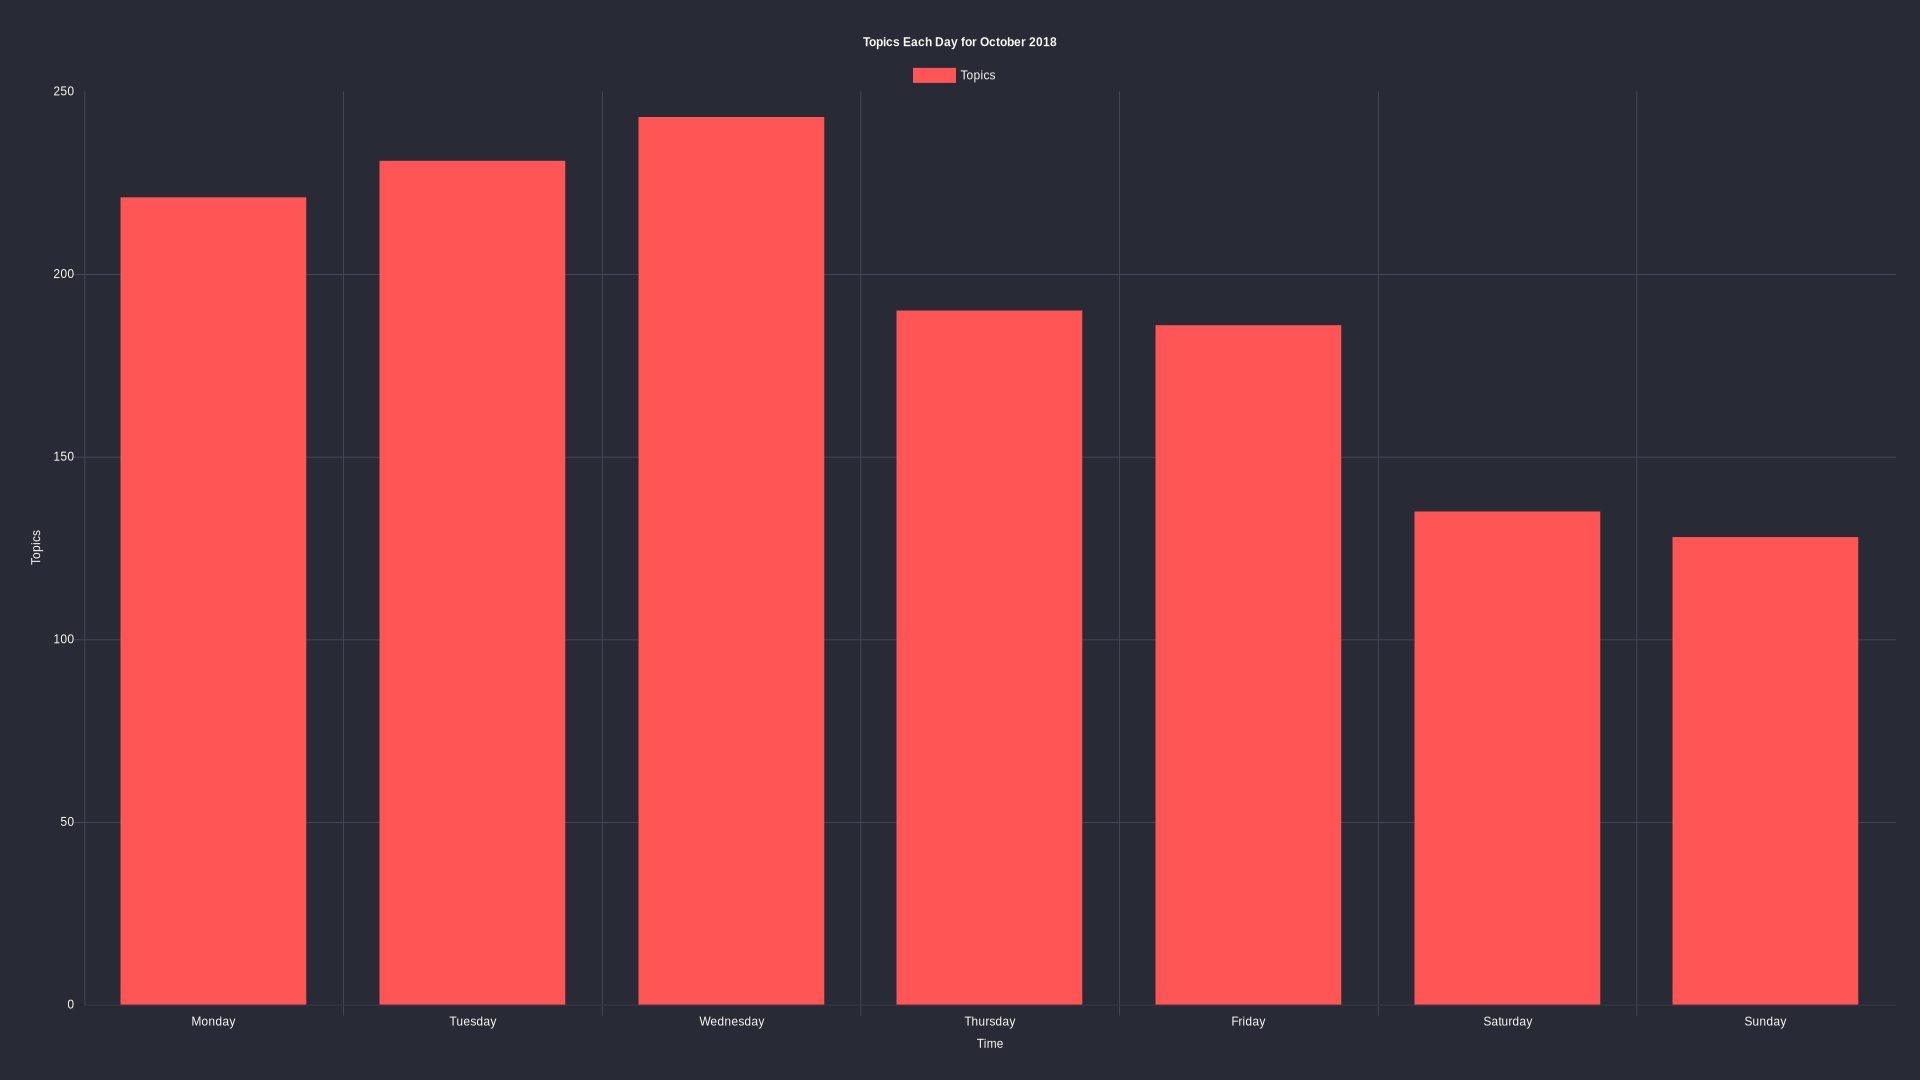
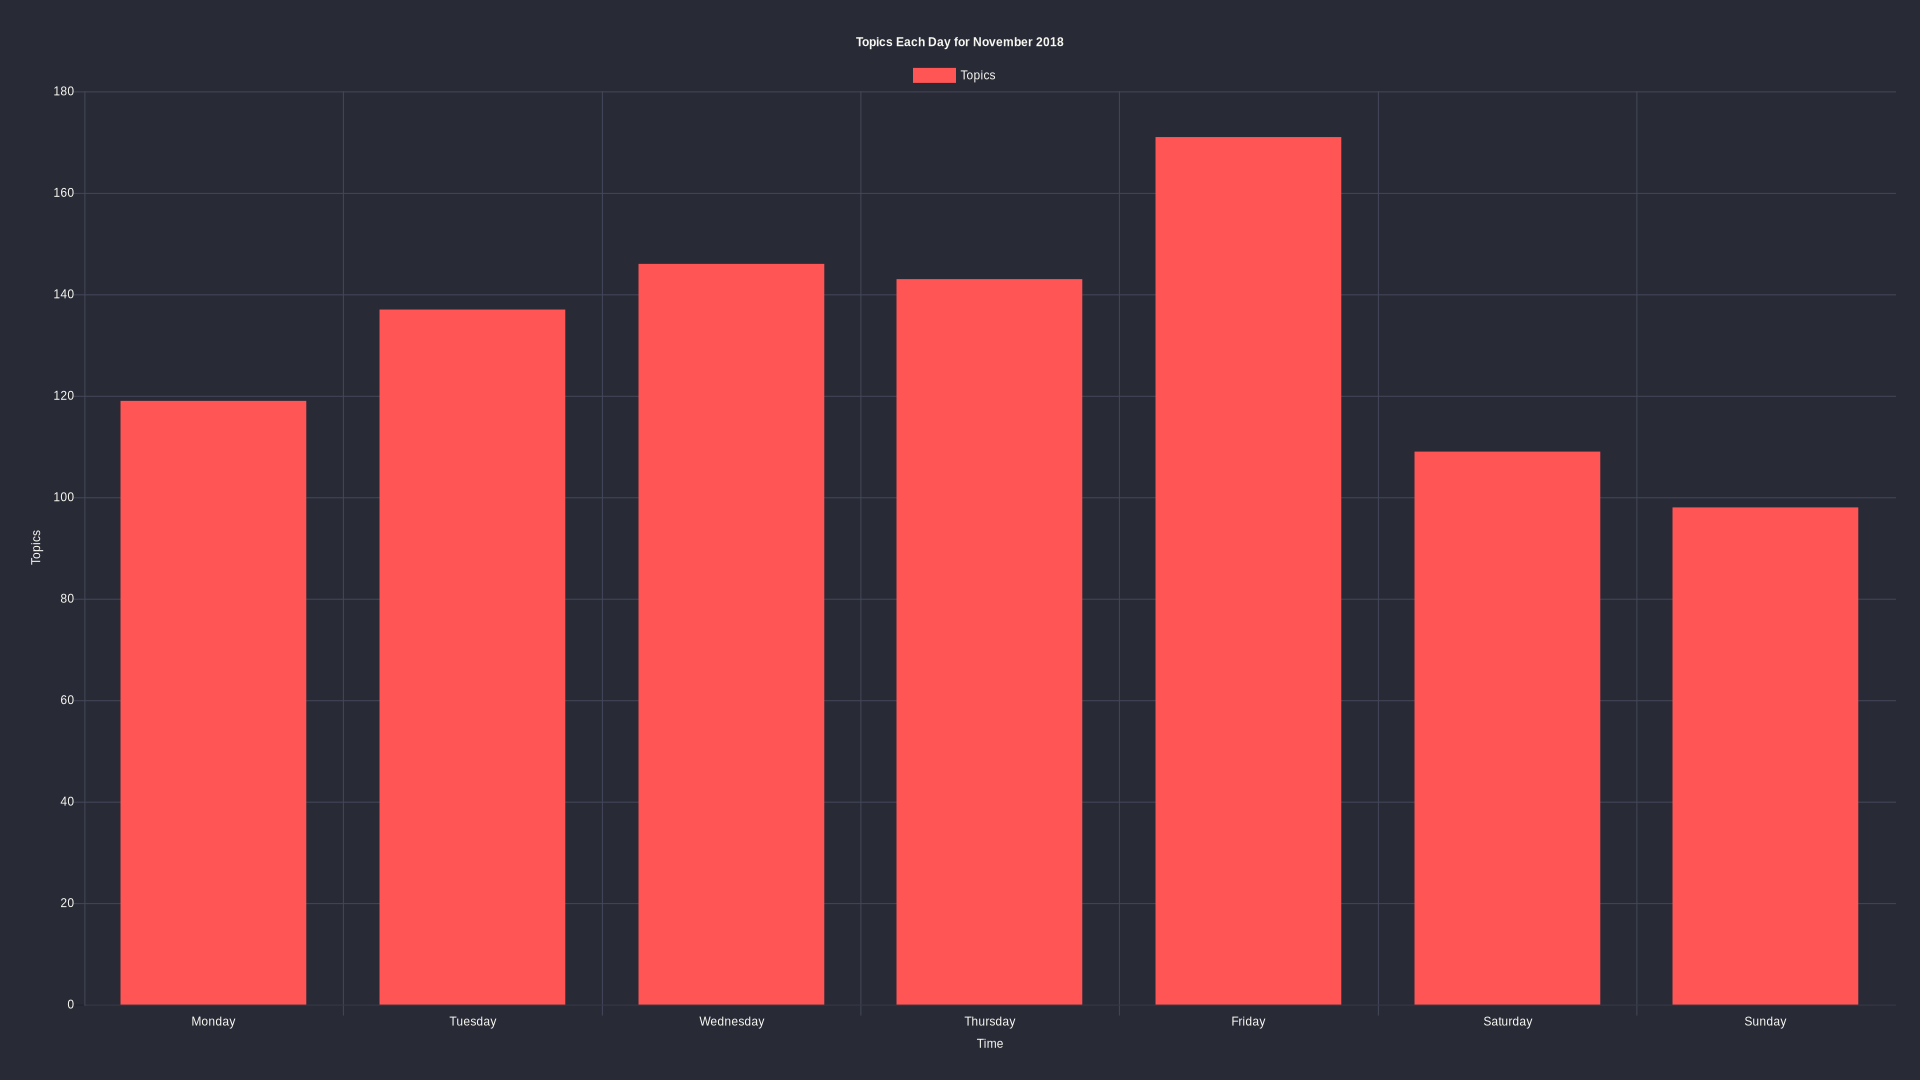
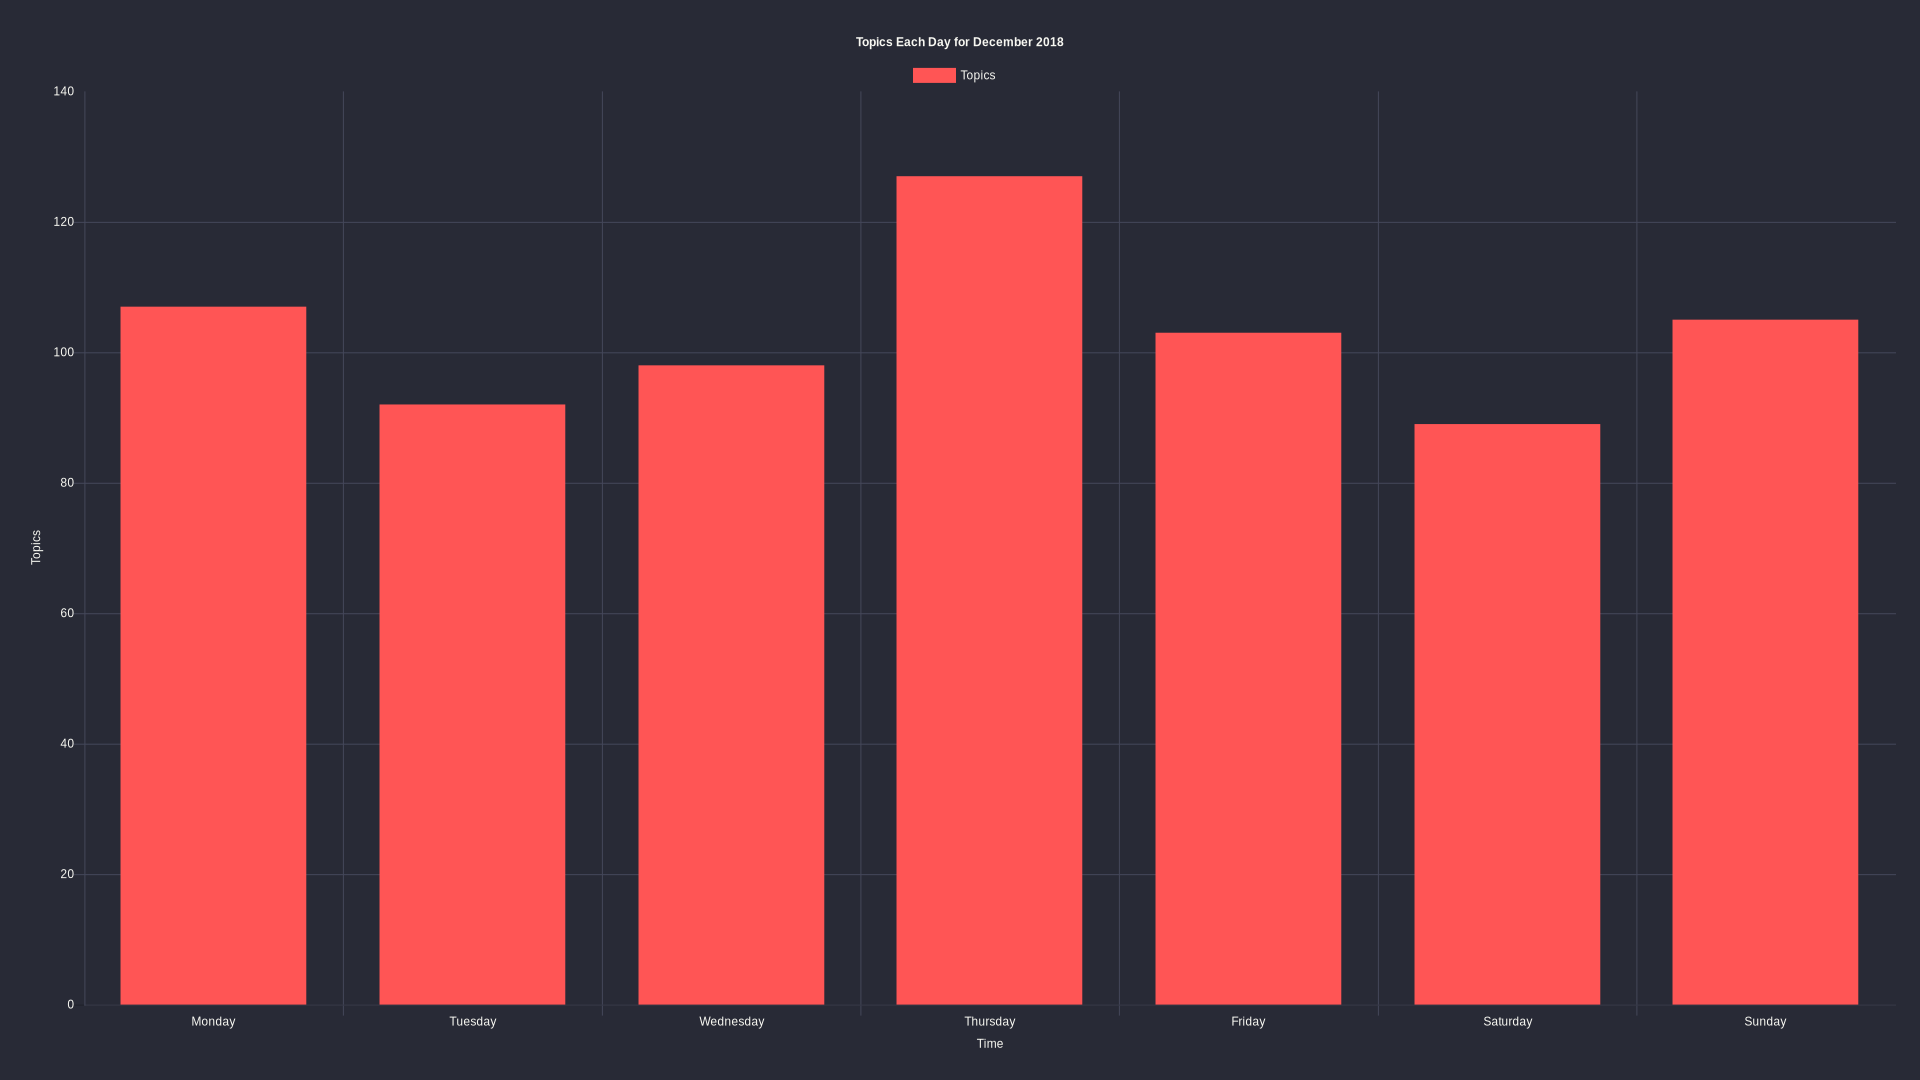
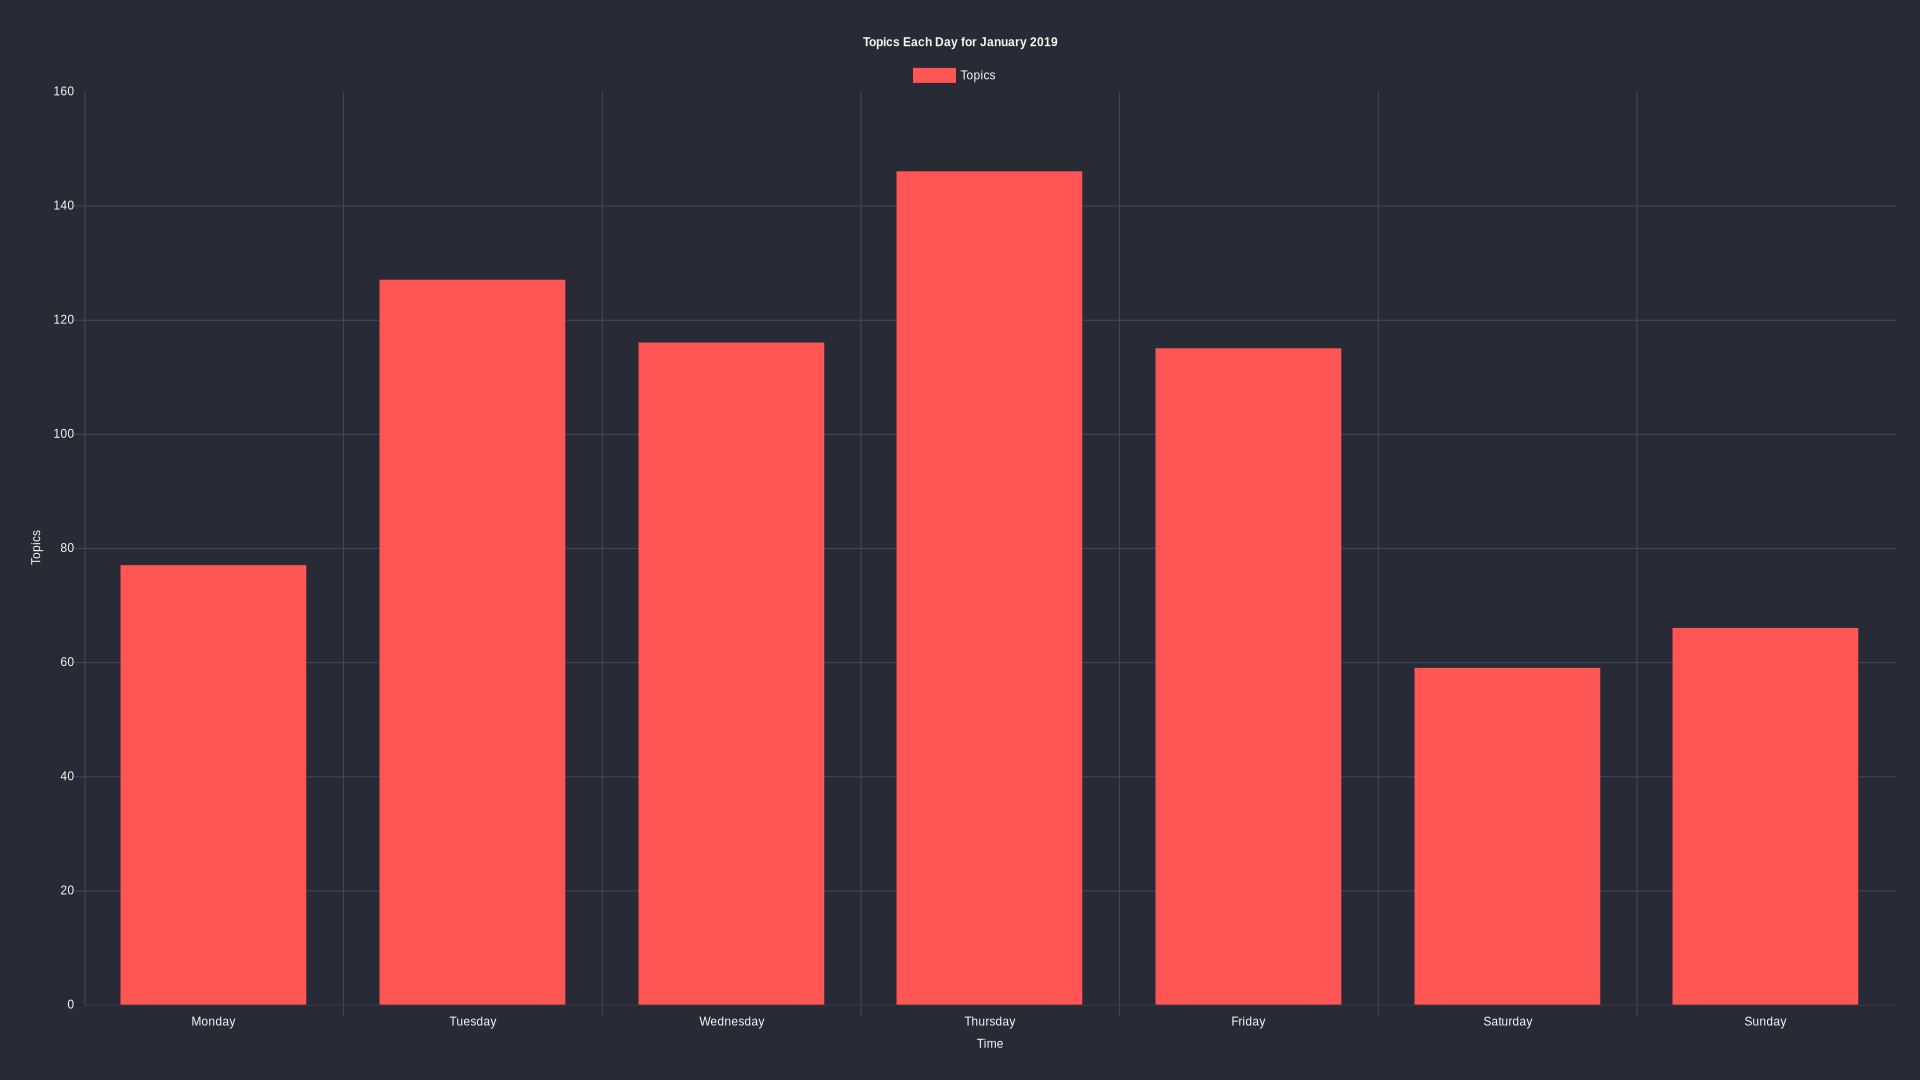
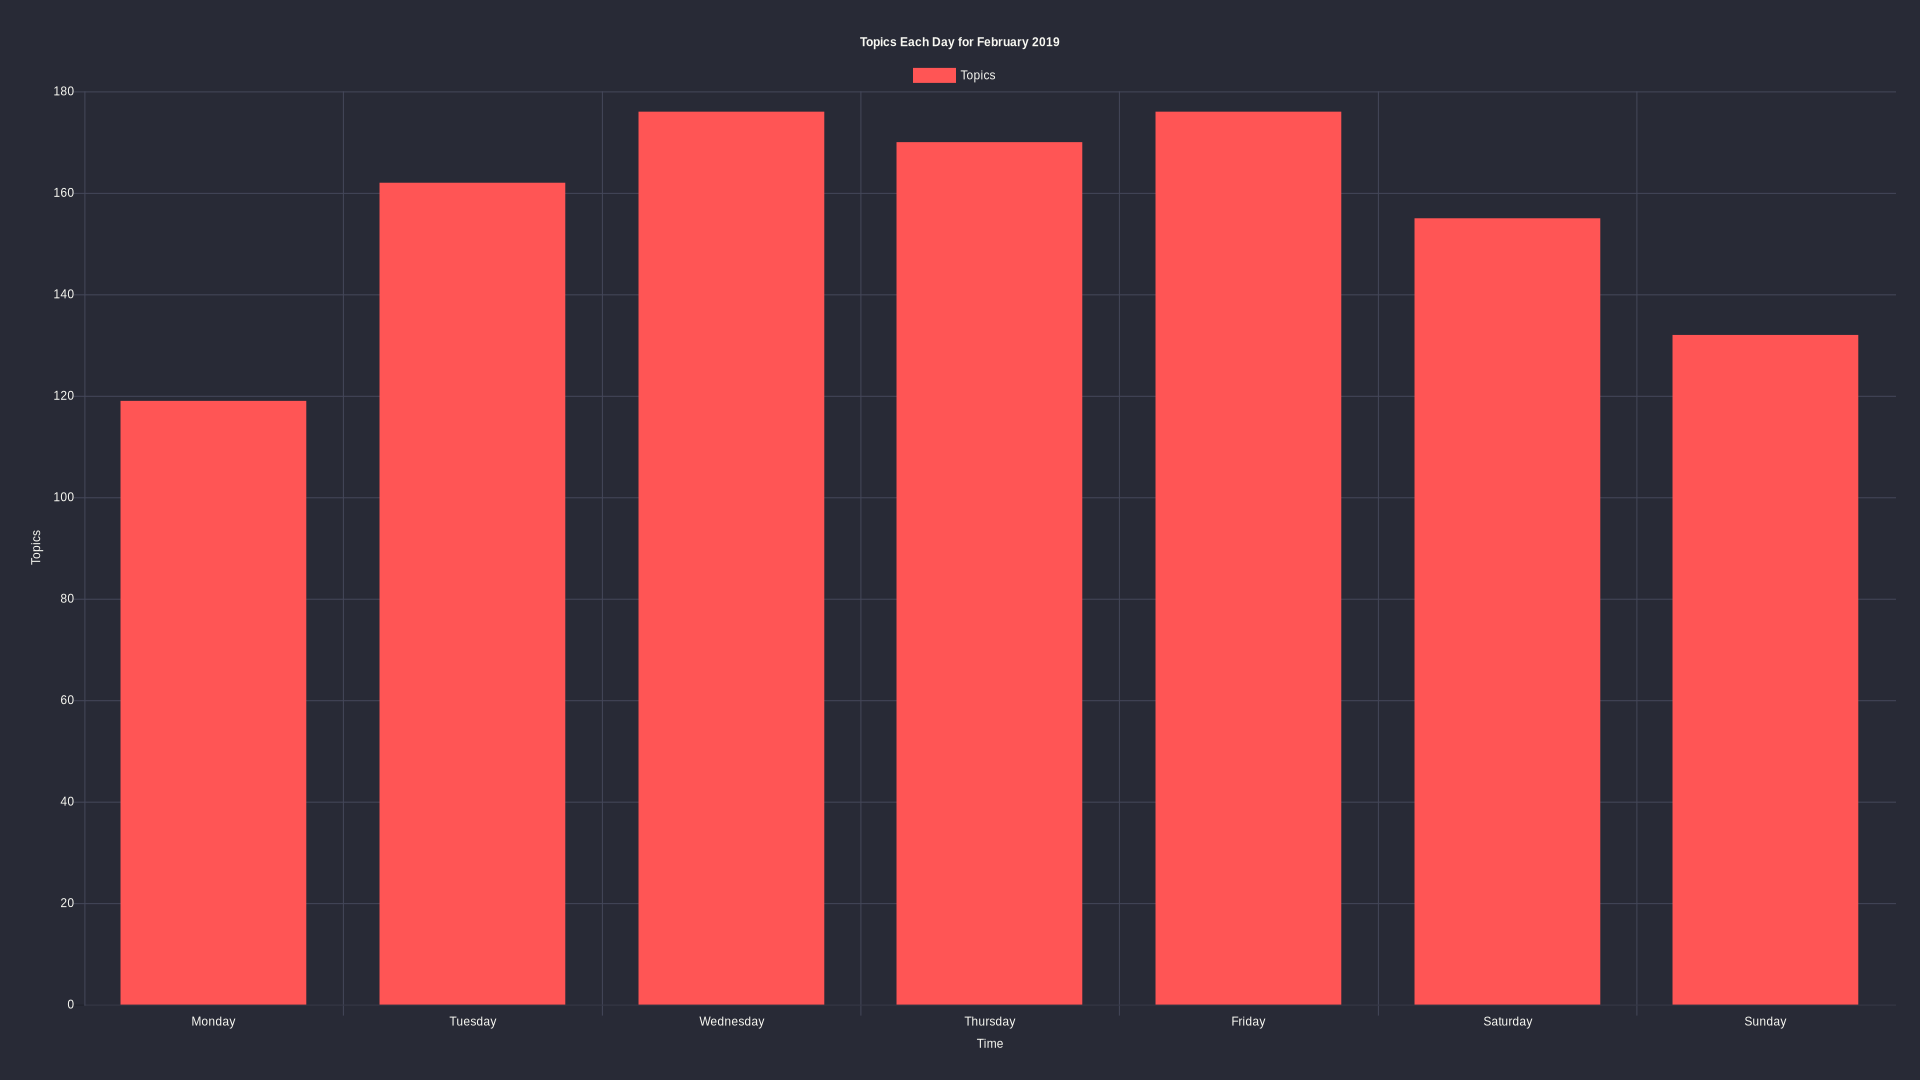
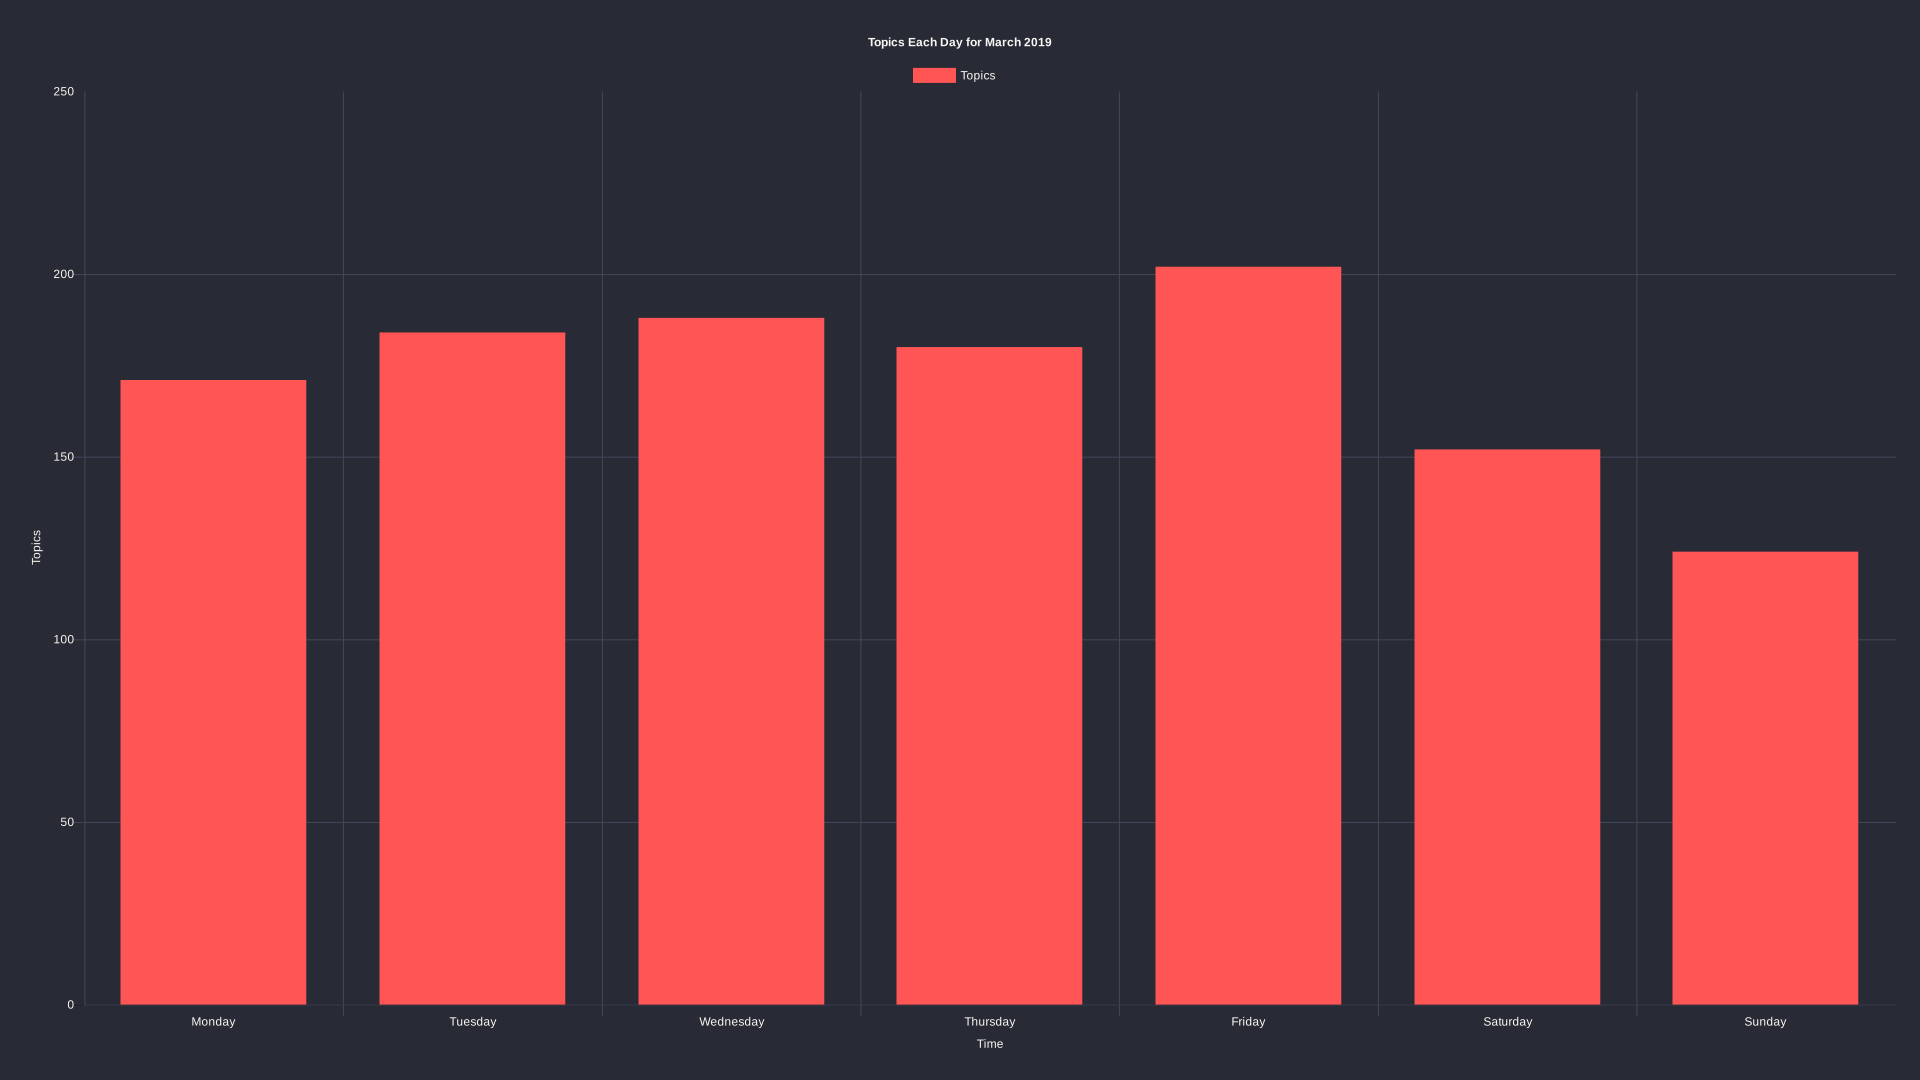
Topics per day: April 2018

Topics per day: May 2018

Topics per day: June 2018

Topics per day: July 2018

Topics per day: August 2018

Topics per day: September 2018

Topics per day: October 2018

Topics per day: November 2018

Topics per day: December 2018

Topics per day: January 2019

Topics per day: February 2019

Topics per day: March 2019

Topics Each Day

Total topics per day

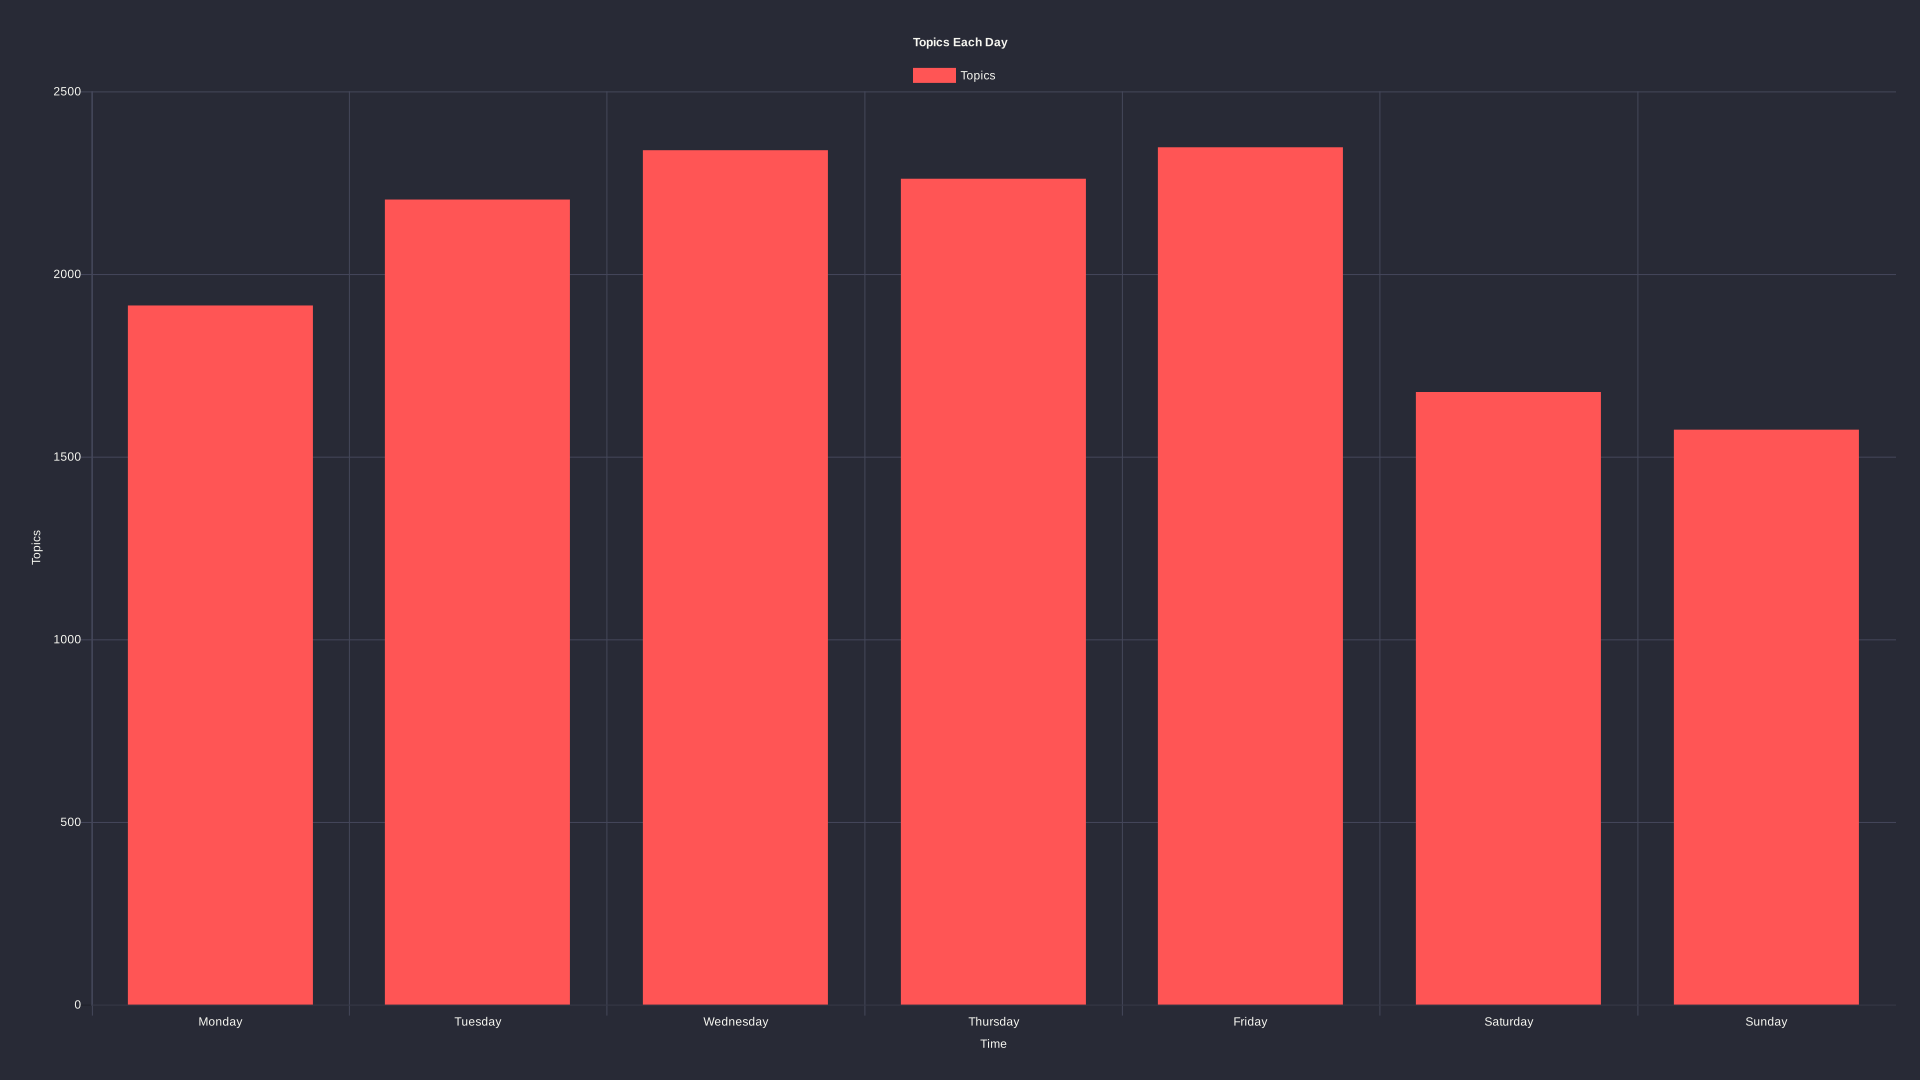
Again the first month only has a select number of days to pull from.

Topics per day: April 2018

Topics per day: May 2018

Topics per day: June 2018

Topics per day: July 2018

Topics per day: August 2018

Topics per day: September 2018

Topics per day: October 2018

Topics per day: November 2018

Topics per day: December 2018

Topics per day: January 2019

Topics per day: February 2019

Topics per day: March 2019